🚀 Supercharge your YouTube channel's growth with AI.
Try YTGrowAI FreeNumPy Gradient: How np.gradient Works on N-dimensional Arrays


The final np.gradient estimate can be negative even when the sample values rise, if the coordinates step backward from 9.0 to 0.1. That negative result makes the role of coordinate order clear to me.
Pair each slope with the coordinate assigned to its sample. Look at the values np.gradient returns at those input positions.
What np.gradient returns
np.gradient estimates derivatives from sampled scalar data. Along selected array axes, each output value estimates the derivative at the matching input position, so the result keeps the input shape.
At an array boundary, only one neighbor lies inside the data, so NumPy uses a one-sided formula.
| Position | Difference used | What to expect |
|---|---|---|
| Interior | Centered, second-order accurate | Uses a sample on each side |
| First and last samples | One-sided, first-order by default | Uses neighboring values inside the array |
| First and last samples with edge_order=2 | One-sided, second-order accurate | Uses more samples and can change the edge estimate substantially |
A one-dimensional input returns one derivative array. For a multi-dimensional input, NumPy returns one array per selected axis, in axis order, and each keeps the input shape.
That output is a numerical estimate from the samples, not a symbolic derivative. The NumPy gradient reference documents the spacing and axis arguments.
The function accepts four input choices. Its call form is np.gradient(f, *varargs, axis=None, edge_order=1), where f is the sampled array, varargs supplies spacing, axis selects dimensions, and edge_order sets the boundary formula.
Match spacing to the samples
Before calling np.gradient, decide what the distance between neighboring samples means because it sets the result units. No spacing argument means unit intervals.
- Pass one scalar when every differentiated axis has the same constant spacing.
- Pass one scalar per selected axis when the constant spacing differs by axis.
- Pass a one-dimensional coordinate array when samples are unevenly spaced. Its length must match the corresponding axis.
- Use axis to select an integer axis or a tuple of axes. With axis omitted, NumPy differentiates along every axis.
If array axes are unfamiliar, our NumPy arrays guide explains shape and dimensions.
Estimate slopes from evenly spaced samples
With default spacing, neighboring array indices differ by one unit. Interior values use samples on both sides, while the ends use one-sided differences.
import numpy as np

ar = np.array([1, 3, 5, 9], dtype=float)
print(np.gradient(ar))

The output is [2, 2, 3, 4], with centered estimates inside the array and one-sided estimates at its ends.
Pass a scalar after the array when the constant interval is not one.
import numpy as np

ar = np.array([1.2, 3.4, 5.6])
print(np.gradient(ar, 3))

Each value is about 0.7333 because the sample changes by 2.2 over a coordinate interval of 3. The spacing scales both boundary and centered estimates.
Use coordinates for uneven samples
When sample intervals differ, pass their physical positions as a coordinate array. Keep it aligned with the values.
import numpy as np

x = np.array([0.0, 0.5, 2.0, 5.0])
y = x**2
print(np.gradient(y, x))
For this example, the estimates are [0.5, 1, 4, 7], not the exact derivative at every point.
| Coordinate x | Sample y = x squared | Estimated derivative |
|---|---|---|
| 0.0 | 0.0 | 0.5 |
| 0.5 | 0.25 | 1.0 |
| 2.0 | 4.0 | 4.0 |
| 5.0 | 25.0 | 7.0 |
For y = x squared, the exact derivative 2x gives [0, 1, 4, 10] at these coordinates. The interior estimates match, while the endpoints differ because no sample sits beyond the array.
The next coordinate array reverses direction at the end, from 9.0 back to 0.1.
import numpy as np

ar = np.array([1.2, 3.4, 5.6], dtype=float)
sp = np.array([7.8, 9.0, 0.1], dtype=float)
print(np.gradient(ar, sp))

I found that the final slope is negative even though the sample values increase, because the last coordinate moves backward. Check that each coordinate belongs to its matching sample before interpreting the sign.
Read each axis of a multidimensional array
For a two-dimensional array, axis 0 runs across rows and axis 1 runs across columns. Calling np.gradient without axis returns both arrays in that order.
import numpy as np

ar = np.array([[1.2, 3.4, 5.6], [7.8, 9.0, 0.1]])
d_rows, d_columns = np.gradient(ar, 2)
print("axis 0 (rows):")
print(d_rows)
print("axis 1 (columns):")
print(d_columns)

Axis names describe array dimensions rather than a universal x/y convention. The first array in the screenshot is the row direction, and the second is the column direction.
If you need only the column direction, select axis 1. The result is one array, rather than a tuple containing derivatives for every dimension.
python3 -c 'import numpy as np; ar=np.array([[1.2, 3.4, 5.6], [7.8, 9.0, 0.1]]); print(np.gradient(ar, axis=1))'
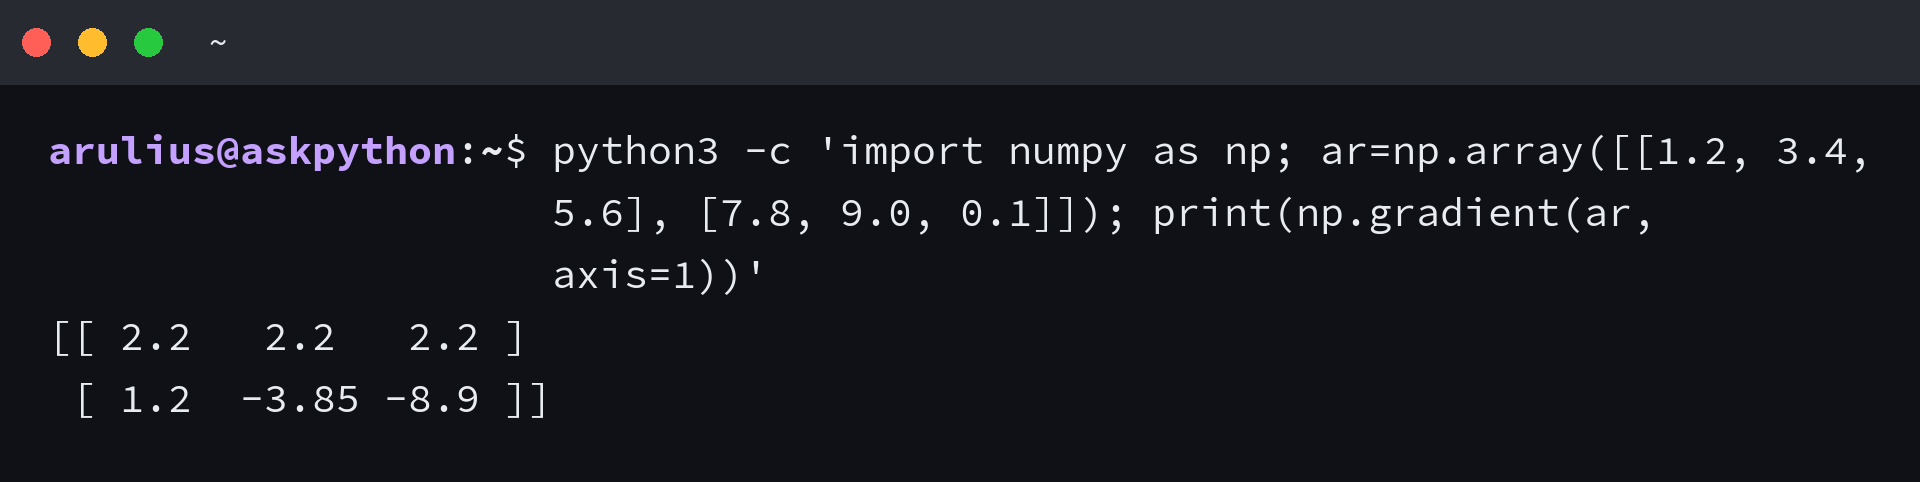
When axis is specified, pass one spacing argument for each selected axis, in the same order. This also applies to coordinate arrays.
Check boundary and shape limits
The edge_order argument accepts 1 or 2 and changes the one-sided formula at each end. For the second-order formula, the selected axis needs at least three samples.
- A coordinate array must have the same length as the dimension it describes.
- When axis selects one dimension, provide one matching spacing argument, not a spacing value for every unselected dimension.
- With edge_order=2, a dimension with only two samples raises ValueError because there are not enough points for the boundary estimate.
import numpy as np

x = np.array([0.0, 1.0, 2.0])
y = np.array([0.0, 10.0, 11.0])
print("edge_order=1:", np.gradient(y, x, edge_order=1))
print("edge_order=2:", np.gradient(y, x, edge_order=2))
edge_order=1: [10.   5.5  1. ]
edge_order=2: [14.5  5.5 -3.5]
I found that edge_order=2 returns -3.5 at the final point here, so I would not treat the higher-order boundary estimate as automatically more trustworthy.
The result follows the second-order one-sided formula. It does not prove the sampled quantity turns downward, so compare an edge estimate with the underlying data before treating it as a measurement.
Keep coordinate units in the result
The units come from the change in values divided by the spacing units, so temperatures measured against seconds produce temperature change per second. Without coordinates, the result is per array index.
import numpy as np

times = np.array([0.0, 0.5, 1.5])
temperatures = np.array([20.0, 21.0, 24.0])
print(np.gradient(temperatures, times))
Use the time coordinates that belong to the measurements, then carry those units into the next calculation. For a larger numerical-model example, continue with our guide to solving coupled differential equations.
Frequently asked questions
These answers clarify output shape, selected axes, coordinate spacing, and what a numerical estimate represents.
Does np.gradient return the same shape as its input?
Yes. Each derivative array has the same shape as the input, whether the function calculates one axis or several.
Why does np.gradient return a tuple for a 2D array?
With no axis selection, NumPy returns one derivative array for each axis. For a 2D array, axis 0 is rows and axis 1 is columns.
Can np.gradient use uneven sample positions?
Yes. Pass a one-dimensional coordinate array for the differentiated axis. Its length must match that axis in the input array.
Is np.gradient an exact derivative?
No. It estimates derivatives from sampled values with finite differences, so the estimate depends on the spacing, the boundary formula, and the underlying data.