Correlation Cycle, CorrelationAngle, Market State - John EhlersHot off the press, I present this "Correlation Cycle, CorrelationAngle, and Market State" multicator employing PSv4.0, originally formulated by Dr. John Ehlers for TASC - June 2020 Traders Tips. Basically it's an all-in-one combination of three Ehlers' indicators. This power packed triplet indicator, being less than a 100 line implementation at initial release, is a heavily modified version of the original indicator using novel techniques that surpass John Ehlers' original intended design.
This
Indicadores y estrategias
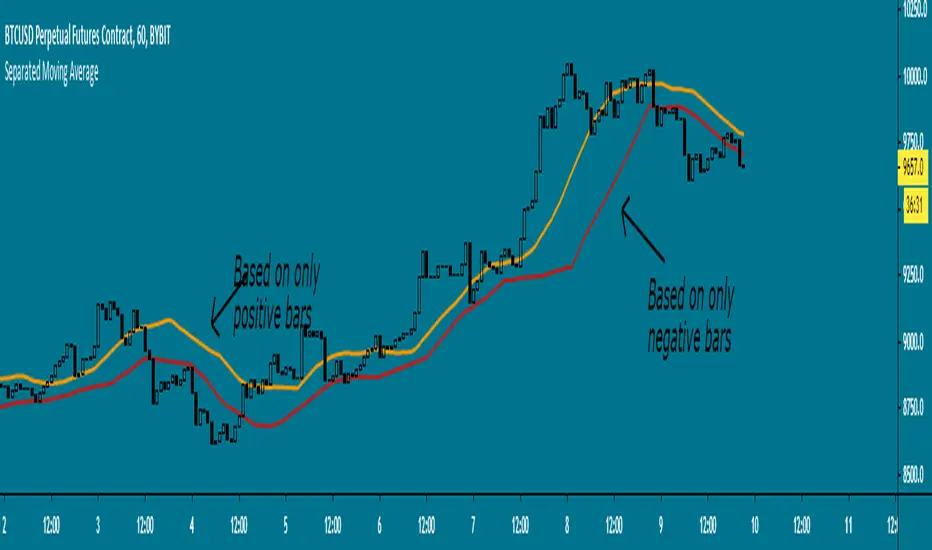
Separated Moving Average - evoHere are two moving averages, one based on positive candles and the other based on negative candles. If the current bar is positive, the negative MA will use its last known negative bar for the calculation. The default setting uses Heikin Ashi to smooth the candles with the trend, you can turn this off if you want in inputs.
Let me know if you find it useful :)
RedK_Supply/Demand Volume Viewer v1Background
============
VolumeViewer is a volume indicator, that offers a simple way to estimate the movement and balance (or lack of) of supply & demand volume based on the shape of the price bar. i put this together few years ago and i have a version of this published for another platform under different names (Directional Volume, BetterVolume) in case you come across them
what is V.Viewer
=====================
The idea here is to find a "simple proxy" for estimating the demand or supply port
Fancy Bollinger Bands [BigBitsIO]This script is for a Bollinger Band type indicator with as many features as I can possibly fit into a Bollinger Band type indicator.
Features:
- A single custom moving average serving as the middle band.
- Standard MA inputs.
- MA type.
- MA period.
- MA price.
- MA resolution (time frame).
- Visibility toggle.
- MA Candle Type
- Fancy MA inputs.
- Toggle to show only candles included in the MA calculation ("Highlight inclusion") or display entire MA history.
- Toggle to show a ghost trail wh
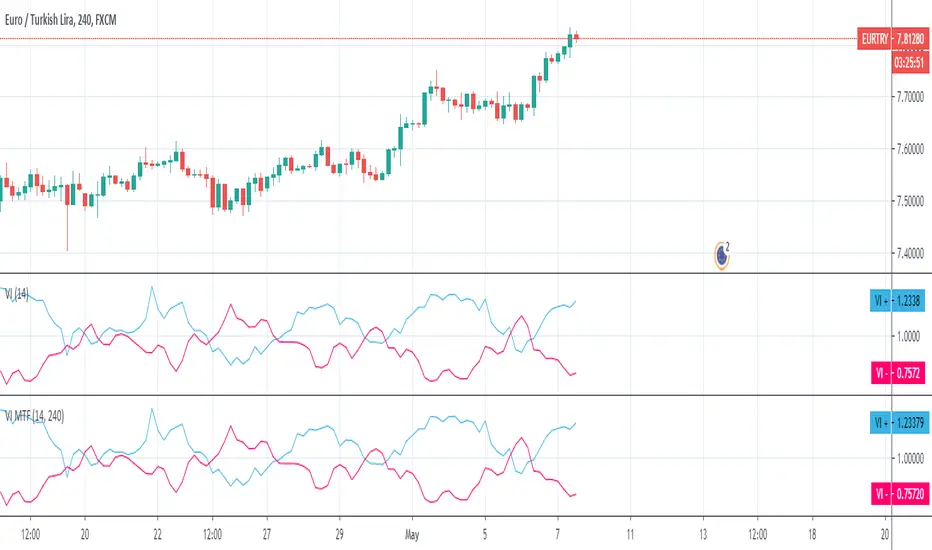
Vortex MTFUnderstanding Vortex Indicator (VI)
The vortex indicator was first developed by Etienne Botes and Douglas Siepman who introduced the concept in the January 2010 edition of “Technical Analysis of Stocks & Commodities.” The vortex indicator is based on two trendlines: VI+ and VI-.
What is the Vortex Indicator (VI)?
A vortex indicator (VI) is an indicator composed of two lines - an uptrend line (VI+) and a downtrend line (VI-). These lines are typically colored green and red respectively. A vor
Stochastic Heat MapA series of 28 stochastic oscillators plotted horizontally and stacked vertically from bottom to top as the oscillator background.
Each oscillator has been interpreted and the value has been used to colour the lines in.
Lower lines are shorter term stochastics and higher lines are longer term stochastics.
The average of the 28 stochastics has been taken and then used to plot the fast oscillator line, which also has a slow oscillator line to follow.
The oscillator line can be used to colour in
Bar Balance [LucF]Bar Balance extracts the number of up, down and neutral intrabars contained in each chart bar, revealing information on the strength of price movement. It can display stacked columns representing raw up/down/neutral intrabar counts, or an up/down balance line which can be calculated and visualized in many different ways.
WARNING: This is an analysis tool that works on historical bars only. It does not show any realtime information, and thus cannot be used to issue alerts or for automated tradi
Pivot Point SupertrendHello All,
There are many types of SuperTrend around. Recently I thought about a Supertrend based on Pivot Points then I wrote "Pivot Point SuperTrend" script. It looks it has better performance on keeping you in the trend more.
The idea is behind this script is finding pivot point, calculating average of them and like in supertrend creating higher/lower bands by ATR. As you can see in the algorithm the script gives weigth to past pivot points, this is done for smoothing it a bit.
As I wr
Yield Curve Percent Inverted**************************************************************************************************
Yield Curve Percent Inverted Indicator
This indicator will check all fifty-five Treasury Bond Yield spreads - every combination from
1-month up to 30-year - and then graph the percentage of spreads which are inverted.
Yield curve inversion occurs when the longer-duration bond pays a lower yield than the shorter-
duration bond. Longer-dated bonds normally pay a higher yield because the investor's
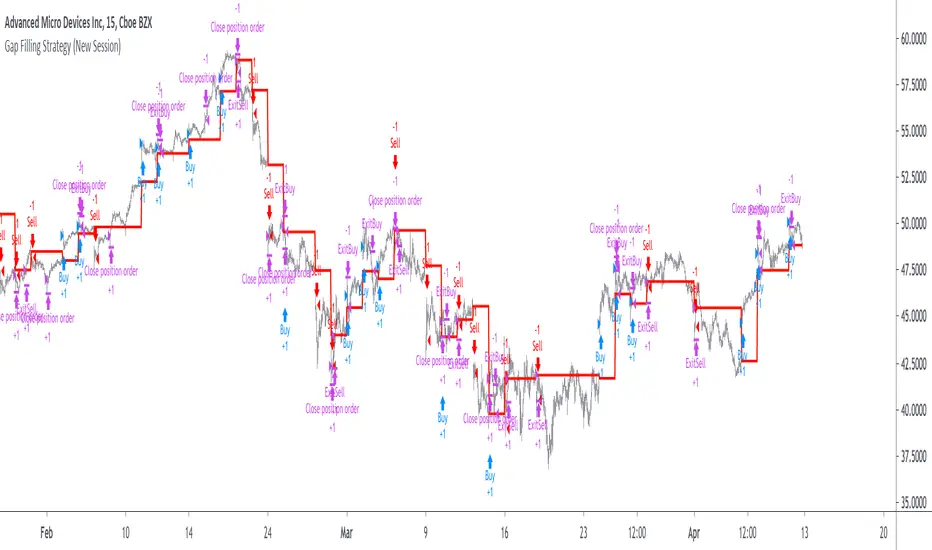
Gap Filling Strategy Gaps are market prices structures that appear frequently in the stock market, and can be detected when the opening price is different from the previous closing price, this is why gaps are also called "opening price jumps". While gaps can occur frequently, some of them are more significant than others, and can be observed when looking at a long term chart.
The following strategy is based on the exploitation of significant gaps occurring during a new session, and posses various options that can r
SPY Expected Move by VIXThis indicator shows 1 and 2 standard deviation price move from the VWAP based on VIX. Implied Volatility (IV) is being used extensively in the Option world to project the Expected Move for the underlying instrument. VIX is used as a proxy for SPY's IV for 30 days.
This indicator is meaningful only for SPY but can be used in any other instrument which has a strong correlation to SPY.
inwCoin Martingale Strategy ( for Bitcoin )** Same as my previous martingale script but this version = opensource **
inwCoin Martingale Strategy is the proof of concept strategy that in the end, anyone who using martingale strategy will kaboom their portfolio.
For those who don't know what is "martingale".. it's a simple double down strategy in the hope to cover the loss in previous entry.
Example
In the game that if you win, you'll get 100% of your bet money back.
1st loss = 1$
2nd loss = bet 2$ : if win, get 2$ / real profit = 1$ ( 2
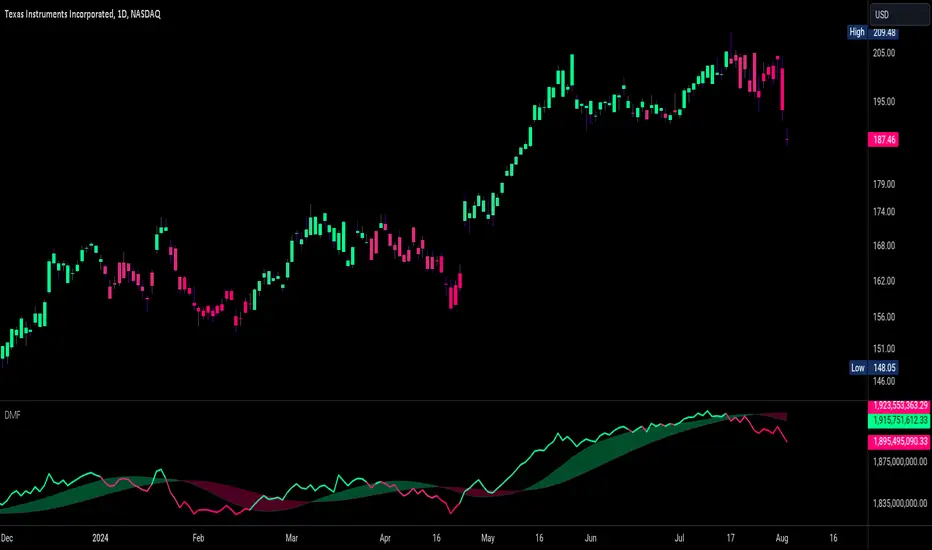
Dynamic Money FlowDynamic Money Flow is a volume indicator based on Marc Chaikin's Money Flow with a few improvements.
It can be used to confirm break-outs and trends.
Zero line crosses and divergences can provide useful signals while considering chart analysis as well.
Two weaknesses of CMF have been already fixed by Colin Twiggs (IncredibleCharts)...
1.CMF uses Chaikin's accumulation/distribution line to calculate the flow of money.
Accumulation/distribution line does not take the gaps into account. This ca
Fearzone PanelFearZone is strategy described in the book (Swedish):
"Framgångsrik Aktiehandel" by: Peter Nilsson, Jonny Torsell, Johan Hellström
Idea: FearZone tries to indicate when a stock has fallen to a level where
fear, instead of common sense, control the further development.
It is only intended for (very) short trades.
Suggestion: Enter a trade (at your own risk) when all columns are green.
Exit as soon as profit is made, but no longer than 5 periods has lasted.
Enhanced Time Segmented VolumeTime Segmented Volume was developed by Worden Brothers, Inc to be a leading indicator by comparing various time segments of both price and volume. Essentialy it is designed to measure the amount of money flowing in and out of an instrument.
Time Segmented Volume was originally ported to TradingView by user @liw0 and later corrected by user @vitelot. I never quite understood how to read Time Segmented Volume until I ran across a version by user @storma where they indicated when price would be l
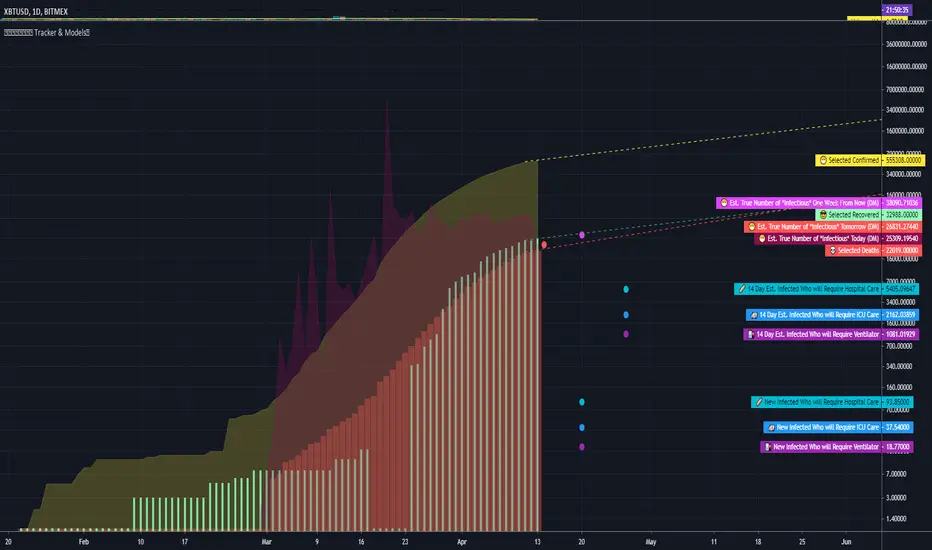
COVID Statistics Tracker & Model Projections by Cryptorhythms😷 COVID-19 Coronavirus Tracker & Statistics Tools by Cryptorhythms 😷
📜Intro
I wanted to put some more meaning behind the numbers for 2020's Covid pandemic. I hope this tool can help people analyze and deal with these hard times. With these metrics I hope to give greater depth and dimension to whats available. While also at the same time creating something that looks decently presentable and gives actionable information.
I had planned on including a few forecasting models and letting the u
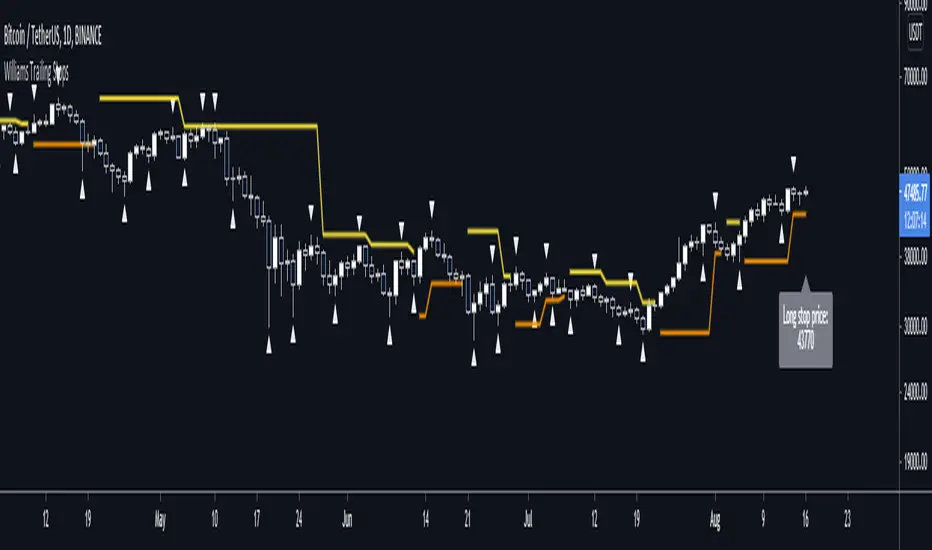
Williams Fractal Trailing StopsUnlike the built-in version, you can configure how many bars it takes to confirm a fractal. This indicator plots all Williams high and low fractals, and a stop line that trails the fractals up and down. Includes long and short stop alerts. You can choose whether the trail flips long-short based on the price being exceeded within a candle or on candle close. This indicator deals only with fractals and doesn't get into the Alligator or anything else.
I've commented it extensively, so that it might
LUBEThis is a chart meant for 30m BTCUSD but could be used for many other assets, and there are inputs to play with.
I decided on the strange title "LUBE" because I was measuring how many of the previous 500 bars had the current price level already been in. I wanted to discover when the price was in a new zone or an area that it hadn't spent much time in recently... the LUBE zone.
Think of the blue line as showing you the current level friction. If the blue line is high, price is quagmired and no
Fancy Triple Moving Averages [BigBitsIO]This script is for three moving averages with as many features as I can possibly fit into a single moving average.
Features:
- Three moving averages (MA1, MA2, MA3).
- Standard MA inputs.
- MA type.
- MA period.
- MA price.
- MA resolution (time frame).
- Visibility toggle.
- MA Candle Type
- Fancy MA inputs.
- Toggle to show only candles included in the MA calculation ("Highlight inclusion") or display entire MA history.
- Toggle to show a ghost trail when Highlight inclusion is toggled on.
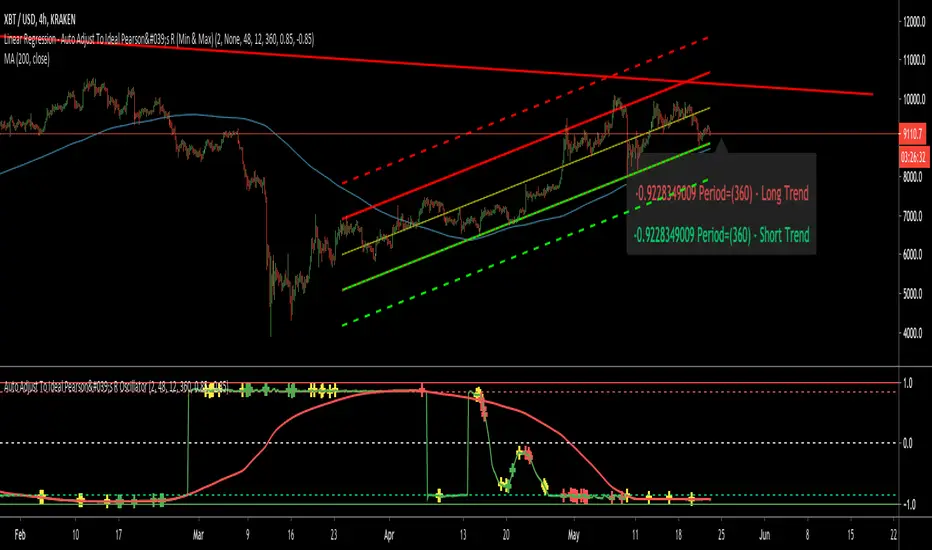
Auto Adjust To Ideal Pearson's R OscillatorThis is meant to be a partner indicator to "Linear Regression - Auto Adjust To Ideal Pearson's R (Min & Max)" which can be found under my profile on the scripts I have made.
It's important the the ideal Pearsons R + and - ideal ranges are the same as the other script so you can visualize the results better and what is going on. I set them to default to 0.85 for strong confidence levels.
This simply graphs what the Pearsons's R Long Term Trend (Red) and Short Term Trend (Green) are doing. I
Trend Following MAs 3DHello All,
This is Moving Averages Trend Following 3D indicator. The idea is based on direction of MAs and relation between 20 moving averages (5 to 100 period).
Option to show different type of MAs: EMA, SMA, RMA, WMA, VWMA.
As I haved tested it looks succesful at calculating trend direction and trend strength.
For a better look I tried to make it 3D, it looks good I think, waiting comments ;)
Some screenshots:
By using RMA type:
When it gets tiny it means there is no trend:
A
(JS) Squeeze Pro OverlaysSo this was something I planned on doing in the future, I knew it would take some time to put together but here it is, the Squeeze Pro 2 Overlays.
On my original Squeeze Pro, I had made several overlay indicators to go along with it, this time my goal was to combine all that stuff into a single indicator and allow the user to turn on and off the specific features they'd prefer to use. The version illustrated in the preview has everything turned on. What is "everything"? Here's the breakdown...
Backward Number of BarsThis indicator was written in order to apply bar limit in strategies and it was published as open code so that everyone can use it. When backtesting with stock market api data, we determine how many bars should be, not from which date the data will be drawn. For example, we can draw 1000 bar data from stock exchange and perform the backtest on this data. You can plan your strategy by checking the number of bars you test with the window () == 1 parameter here while checking through Tradingview to