MY:Aggregated Volume BTC:SPOT█ MY Aggregated Volume BTC SPOT
This indicator shows a panel to display the Bitcoin Trading Volume of different exchanges. A lot of traders follow the default volume indicator provided by tradingview. This default indicator shows the volume for the current ticker (example BTCUSD:BITSTAMP), but each exchange has its own volume.
In a matter of visibility and accessibility, I've decided to aggregate the volume of almost all the Bitcoin exchanges (tickers) in tradingview. Some have been commented ou
Indicadores y estrategias
3Commas BotBjorgum 3Commas Bot
A strategy in a box to get you started today
With 3rd party API providers growing in popularity, many are turning to automating their strategies on their favorite assets. With so many options and layers of customization possible, TradingView offers a place no better for young or even experienced coders to build a platform from to meet these needs. 3Commas has offered easy access with straight forward TradingView compatibility. Before long many have their brokers hooked u
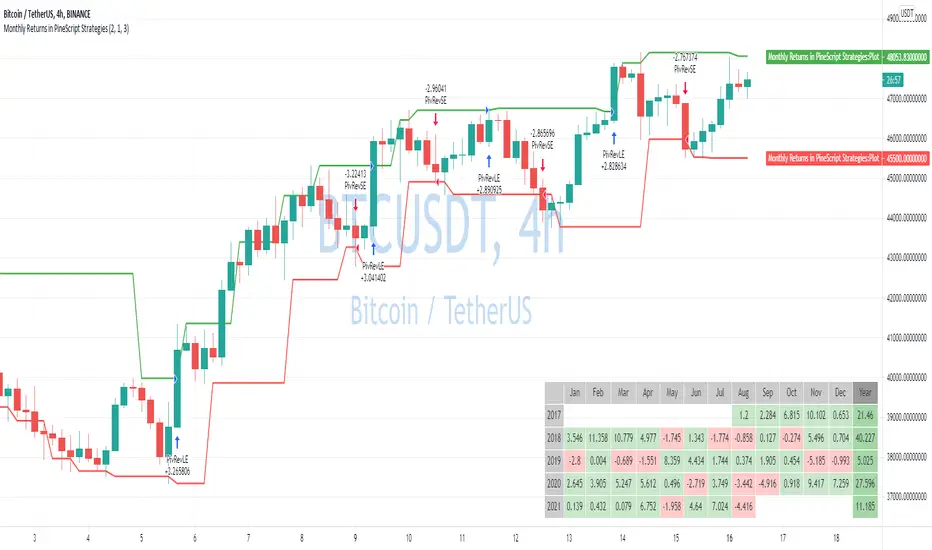
Monthly Returns in PineScript StrategiesI'm not 100% satisfied with the strategy performance output I receive from TradingView. Quite often I want to see something that is not available by default. I usually export raw trades/metrics from TradingView and then do additional analysis manually.
But with tables, you can build additional metrics and tools for your strategies quite easily.
This script will just show a table with monthly/yearly performance of your script. Quite a lot of traders/investors used to look at returns like that.
Zigzag CloudThis is Bollinger Band built on top of Zigzags instead of regular price + something more.
Indicator presents 7 lines and cloud around it. This can be used to visualize how low or high price is with respect to its past movement.
Middle line is moving average of last N zigzag pivots
Lines adjacent to moving average are also moving averages. But, they are made of only pivot highs and pivot lows. Means, line above moving average is pivot high moving average and line below moving average
MESA Stochastic Multi LengthJohn Ehler's MESA Stochastic uses super smoothing to give solid signals. This indicator uses the same rules as every other Stochastic indicator so it would be worth looking into if you are not already familiar with reading a Stochastic. There are 4 different lengths displayed to give traders an edge on reading the market. This is a great tool to analyze waves and find tops and bottoms. It gives great pump and dump signals and even helps filter out bad trades when used with other indicators such
Fast Fourier Transform (FFT) FilterDear friends!
I'm happy to present an implementation of the Fast Fourier Transform (FFT) algorithm. The script uses the FFT procedure to decompose the input time series into its cyclical constituents, in other words, its frequency components , and convert it back to the time domain with modified frequency content, that is, to filter it.
Input Description and Usage
Source and Length :
Indicates where the data comes from and the size of the lookback window used to build the dataset.
Sta
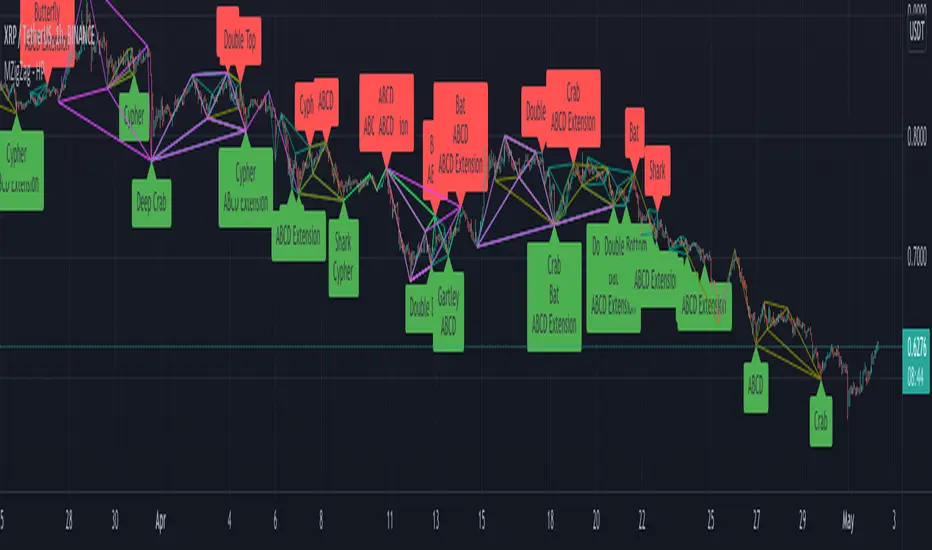
Multi ZigZag Harmonic PatternsCombining Multizigzag with harmonic patterns - this script generates harmonic patterns based on multiple deapth zigzags.
Input parameter allows to chose which Zigzag to be included in pattern identification and set different length, line color, width and style for each Zigzag combinations.
Pattern rules are as below:
Gartley
xab = 0.618
0.382 <= abc <= 0.886
1.272 <= bcd <= 1.618 OR xad = 0.786
Crab
0.382 <= xab <= 0.618
0.382 <= abc <= 0.886
2.24 <= bcd <= 3.618 OR xad
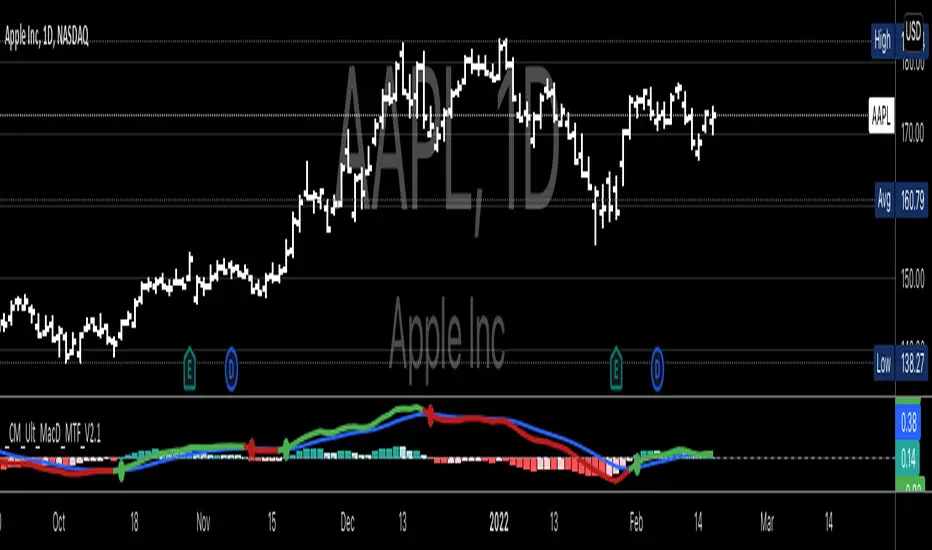
CM MACD Custom Indicator - Multiple Time Frame - V2***For a Detailed Video Overview Showing all of the Settings...
Click HERE to View Video
New _CM_MacD_Ult_MTF _V2 Update 07-28-2021
Thanks to @SKTennis for help in Updating code to V2
Added Groups to Settings Pane.
Added Color Plots to Settings Pane
Switched MTF Logic to turn ON/OFF automatically w/ TradingView's Built in Feature
Updated Color Transparency plots to work in future update
Added Ability to Turn ON/OFF Show MacD & Signal Line
Added Ability to Turn ON/OFF Show Hist
KINSKI Volume Regression TrendRegression trends are typically used to determine when a price is unusually far from its baseline. The script calculates the linear regression of volume and price to determine the trend direction and strength. This can be used to determine the volume support for upward/downward trends.
As a special feature, this indicator allows you to choose from three (as of 07/20/2021) templates with special presets.
The following templates are available:
"Precise" (Period: 4, Smoothing Factor Type: "DI
Probability Distribution HistogramProbability Distribution Histogram
During data exploration it is often useful to plot the distribution of the data one is exploring. This indicator plots the distribution of data between different bins.
Essentially, what we do is we look at the min and max of the entire data set to determine its range. When we have the range of the data, we decide how many bins we want to divide this range into, so that the more bins we get, the smaller the range (a.k.a. width) for each bin becomes. We then
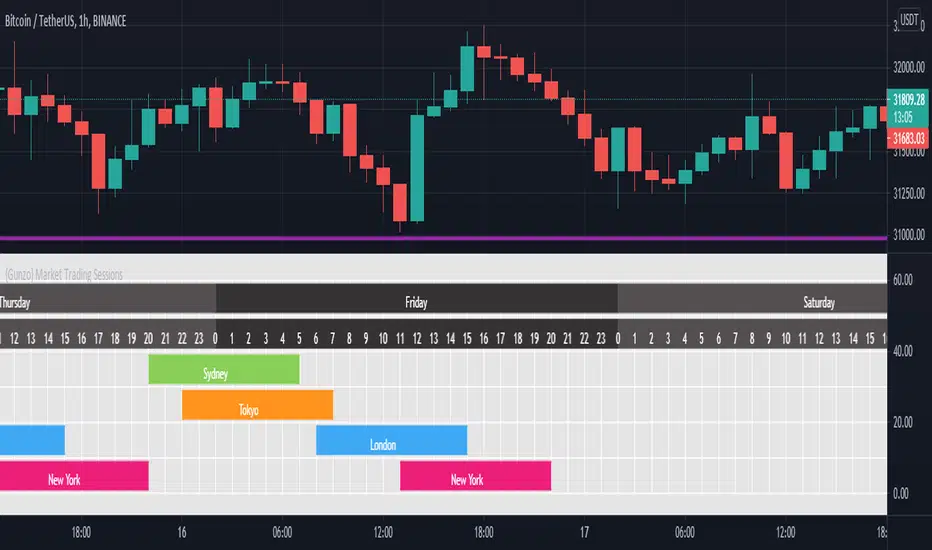
{Gunzo} Market Trading Sessions (Tokyo, London, New York)Market Trading Sessions is a tool designed to help traders to find the best times of the day for price action trading. It displays non-overlapping visuals for the major trading sessions : Oceania, Asia, Europe, and USA.
OVERVIEW :
This tool has been designed to match all the following requirements that I needed for optimal usage :
Display opening and closing of main markets
See clearly market sessions (non-overlapping colors)
Display Sydney session if wanted
Display GMT hours and da
Volume Profile / Fixed RangeHello All,
This script calculates and shows Volume Profile for the fixed range . Recently we have box.new() feature in Pine Language and it's used in this script as an example. Thanks to Pine Team and Tradingview!..
Sell/Buy volumes are calculated approximately!.
Options:
"Number of Bars" : Number of the bars that volume profile will be calculated/shown
"Row Size" : Number of the Rows
"Value Area Volume % " : the percent for Value Area
and there are other options for coloring
Portfolio Backtester Engine█ OVERVIEW
Portfolio Backtester Engine (PBTE). This tool will allow you to backtest strategies across multiple securities at once. Allowing you to easier understand if your strategy is robust. If you are familiar with the PineCoders backtesting engine , then you will find this indicator pleasant to work with as it is an adaptation based on that work. Much of the functionality has been kept the same, or enhanced, with some minor adjustments I made on the account of creating a more subjectiv
RedK Portfolio Tracker [Table Version]RedK Portfolio Tracker is a simple tool that enables a trader to monitor and track a portfolio of up to 10 holdings (+ free cash) in real time - directly on the chart
Now that we have tables in Pine, this is a table version of my previously published Portfolio Tracker
- The table works better in visualizing the various table elements (title row, column labels..etc), and is more flexible in allowing color coding of gain/loss. for many traders, myself included, these simple visual signals are
How to use Leverage and Margin in PineScriptEn route to being absolutely the best and most complete trading platform out there, TradingView has just closed 2 gaps in their PineScript language.
It is now possible to create and backtest a strategy for trading with leverage.
Backtester now produces Margin Calls - so recognizes mid-trade drawdown and if it is too big for the broker to maintain your trade, some part of if will be instantly closed.
New additions were announced in official blogpost , but it lacked code examples, so I hav
Normalized Oscillators Spider Chart [LuxAlgo]This indicator displays a spider chart overlaid on the user’s current chart allowing the visualization of information given by various normalized oscillators. It is possible to customize the spider chart by hiding certain oscillators from within the settings which removes their corresponding spokes from the chart.
Users can control the length settings of each oscillator individually or use a global length setting that applies to every oscillator. An additional meter element is displayed and a
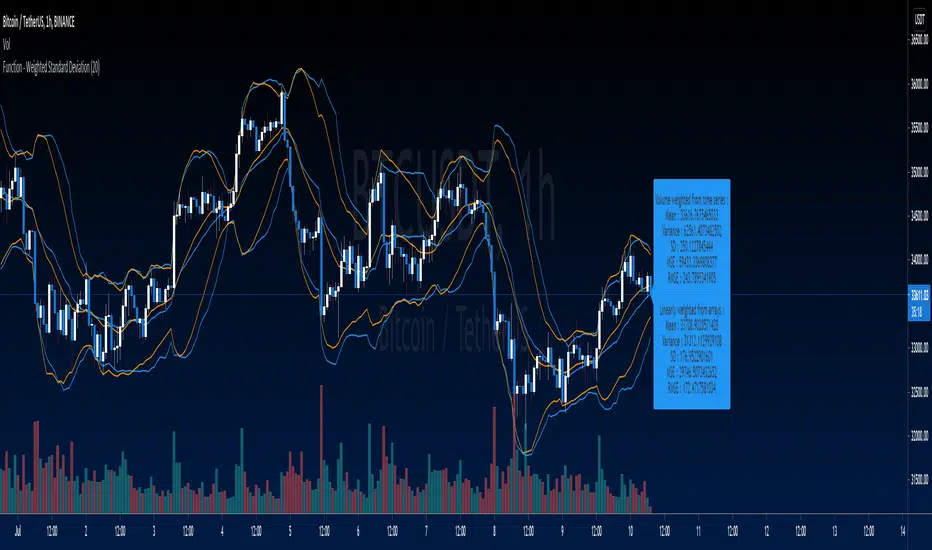
Weighted Harrell-Davis Quantile Estimator with AbsoluteDeviation
QUANTILE ESTIMATORS
Weighted Harrell-Davis Quantile Estimator with Absolute Deviation Fences.
DISCLAIMER:
The Following indicator/code IS NOT intended to be a formal investment advice or recommendation by the author, nor should be construed as such. Users will be fully responsible by their use regarding their own trading vehicles/assets.
The following indicator was made for NON LUCRATIVE ACTIVITIES and must remain as is, following TradingView's regulations. Use of indicator and thei
Dominance tagcloud [experimental] This script is mainly about 2 techniques:
- rectangles that don't overlap with the use of random() -> f_overlap(x1_a, y1_a, x2_a, y2_a, x1_b, y1_b, x2_b, y2_b)
- using a "while loop" (inspired by @ricardosantos)
The loop:
for x = 0 to 999999
if ...
do ...
continue
else ...
break
resembles a "while loop"
There are 2 settings :
"Moving Boxes?"
- enabled: the boxes are made and move randomly
- disabled: the boxes are randomly made, without moving
RedK Slow_Smooth Average (RSS_WMA)RedK Slow Smooth Average (RSS_WMA) is based on simple, multi-WMA passes to generate a moving average that sacrifices low-lag and fast responsiveness for the sake of smoothness.
This smoothness enables an increased trader ability to visualize and track longer-term trends and removes the noise of smaller, relatively insignificant price fluctuations.
Notes:
=========
* RSS_WMA is deliberately built to be a "lazy line" - and it works in a different way to other common moving averages that attempt