Steamworks Documentation
Steam Frame Debugging
The Steam Frame runs on SteamOS, which is a gaming focused Linux distribution based on Arch. This means you have a full computer available to clearly debug what's going on with your application.
Tip: If you are developing on Windows, WinSCP is a nice tool for transferring files to/from the device.
The overlay is made of 2 parts: a colored history graph representing game frame times and some raw numbers.
The samples on the graph are colored as follows:
The bottom row is drawn with a gradient color to show passage of time, with the gradient cycling every second.
The numbers give additional information on frame times, how the game is submitting frames, and information on power usage.
First line: "G:" is average and peak GPU frame time, "C:" is average and peak CPU frame time, "[xx]" is the target game loop framerate (which might be the display refresh rate, or an integer divisor of it when the game is not making framerate), "aaaaxbbbb" is the resolution of the per-eye images submitted by the game. Note that the average frame times are expressed in frames per second, unless the game renders fast enough and the display switches to reporting the value in milliseconds.
Second line: the first number is how much time SteamVR's compositor is using per frame in milliseconds, the "@" second number is the current frequency of the GPU in MHz, the "xxW" third number is the average power draw over the past two seconds in Watts.
Third line (may be on the first line in older versions): "Dxx" indicates the format of depth textures submitted by the game when applicable, "Mxx" indicates the format of motion vectors textures submitted by the game when applicable, "skip" indicates the number of frame discontinuity detected in app poses (these events will skip motion smoothing for one frame).
The recording is only active when a VR application is running locally. Files are stored in the SteamVR Logs folder (/home/steamos/.local/share/Steam/logs, or accessible through the alias cdl from a shell) with a prefix perfrecording- followed by the Steam application ID and the date/time the recording was initiated (for example: perfrecording-steam.app.445960-2026-09-04_15-16-43.csv). The files are formatted as Comma Separated Values (CSV), with the following metrics available on a periodic interval (sample):
The top part of the CSV file also contains a summary:
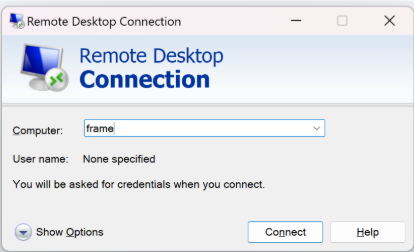
To connect, open up Remote Desktop Connection in Windows, and enter frame as the Computer.
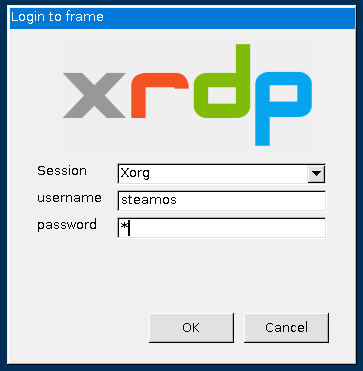
Once connected, you’ll see an XRDP login screen. Xorg should be the default session, the username is steamos and the password is whatever you had previously set in Developer Mode settings.
Alternatively, you can adb into the headset by plugging the headset directly into your PC with a USB cable. If you do not have adb already installed, you can install it as part of the Android SDK Platform Tools. Note that adb can also be used to connect to lepton instances. Once it is installed, you can connect to your device with:
Once connected to headset there are a variety of helpful commands for you to use:
We recommend using the SteamOS Devkit Tool to upload your application to the device, that will create a Steam entry that you can easily add launch options to.
Before your game will show up, you will need to launch it with the renderdoc vulkan layer enabled. This can be done by setting the environment variable ENABLE_VULKAN_RENDERDOC_CAPTURE=1. You can do this in Steam by clicking the app's gear icon and editing the command line to be:
If the capture button is disabled or not working and you see the API listed as Not Presenting you may need to add EnableFrameEndMarkers=1 to your launch options as well (before %command%).
The recording has to be manually triggered to begin and end, so it's best if the issue is ongoing or if you think you can reproduce the issue without too much effort. Ideally we'd want to see tracking go from working to broken within the capture window so we can see the moment something goes wrong. If tracking recovers, it's also useful to include that recovery in the dataset.
Developer Mode
To connect to the headset via ssh, adb, or rdp you first need to enable Developer Mode as described in the steamframe/setup. This will allow you connect and deploy to the headset.Tip: If you are developing on Windows, WinSCP is a nice tool for transferring files to/from the device.
See the headset view remotely
You can use Steam Link to view the headset's view remotely. Using the iOS or Android app just connect to frame. On desktop you can open Steam > Settings > Remote Play and then next to frame you'll see Connect. The first time you launch Steam Link on PC it will come up full screen. Use alt+enter to switch to windowed mode. It will remember this setting on future launches.Performance Graph
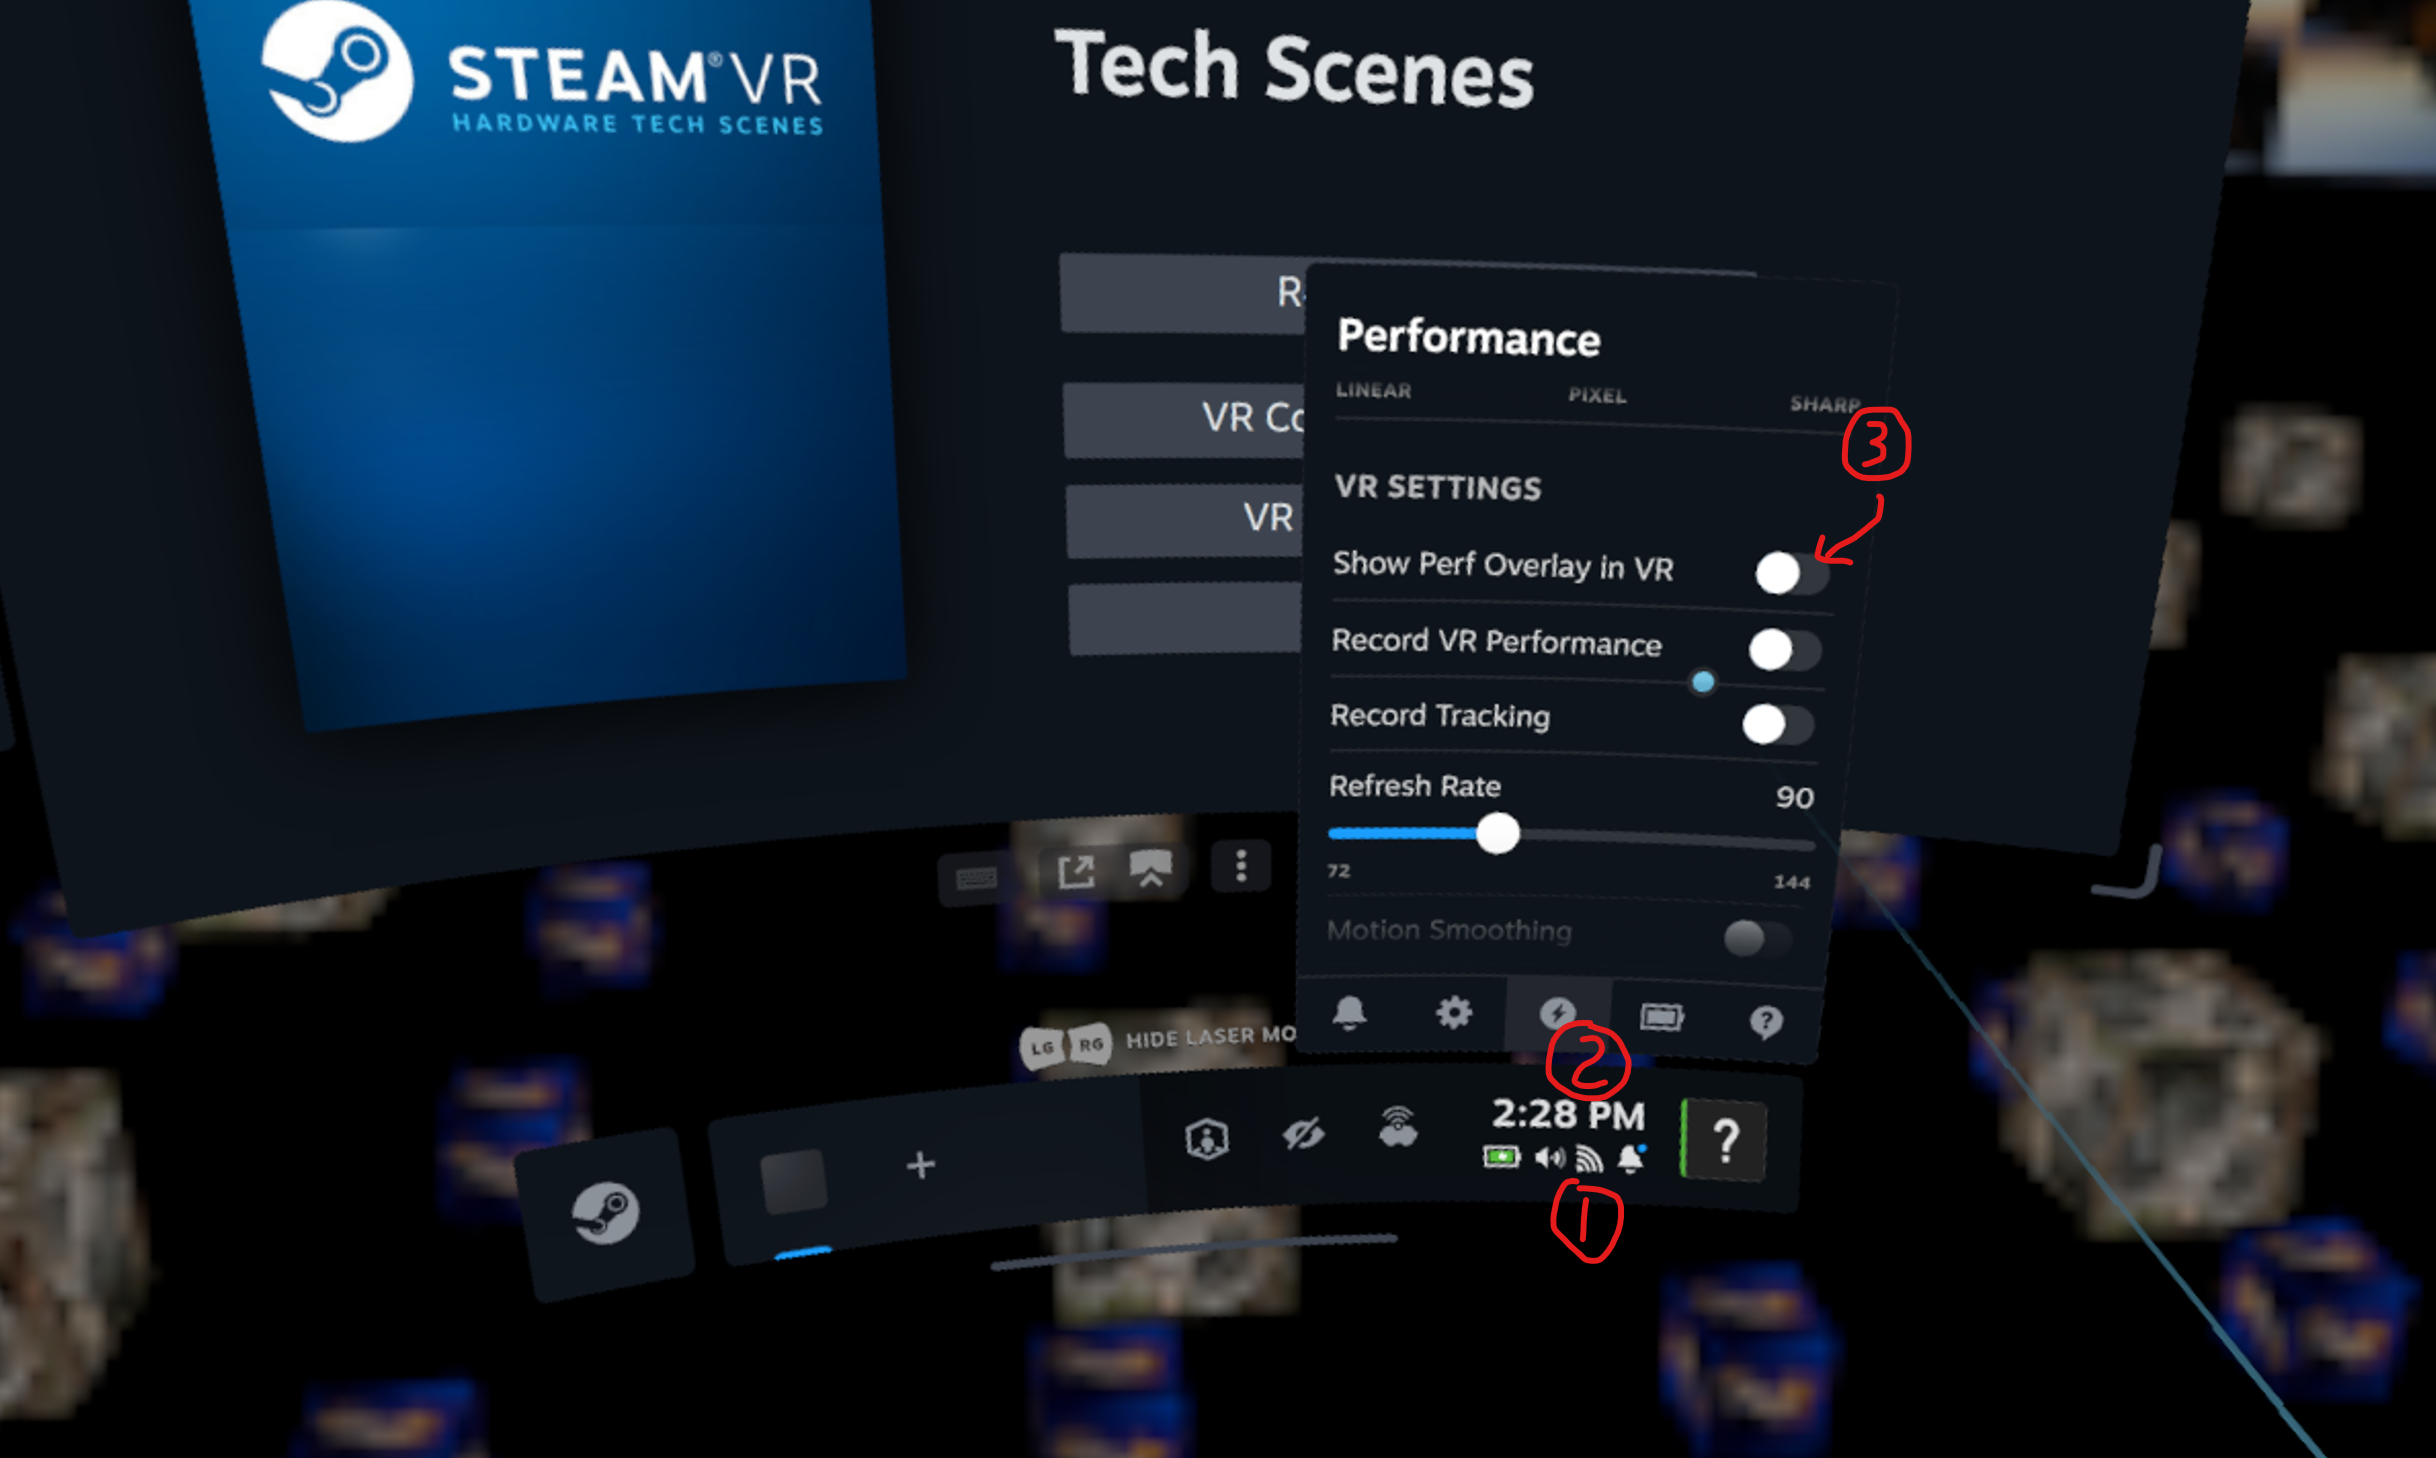
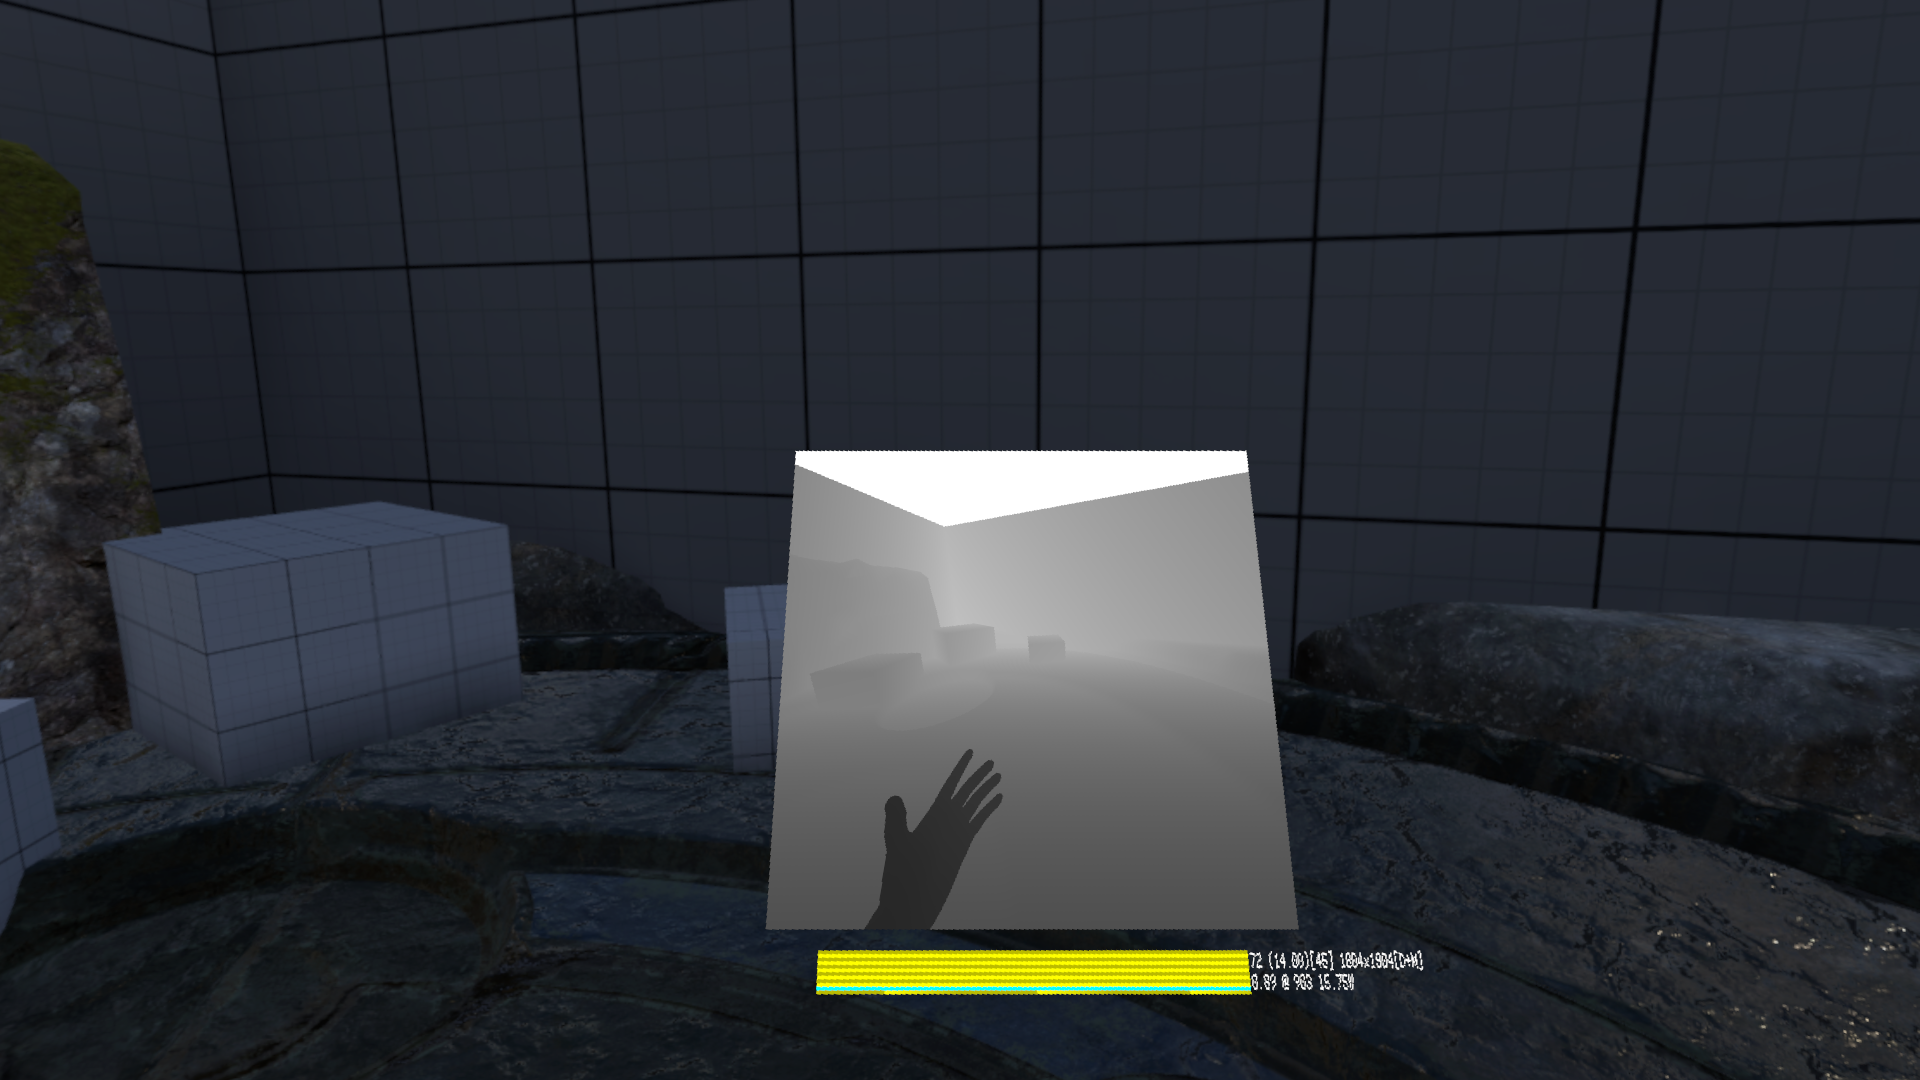
You can turn on the in-headset performance graph from the Quick Access Menu: click the Clock button in the lower right hand corner of the Dashboard, then the Performance button, scroll down to VR Settings and toggle Show Perf Overlay In VR.The overlay is made of 2 parts: a colored history graph representing game frame times and some raw numbers.
The samples on the graph are colored as follows:
- Green indicates frame times within budget. In other words, they mean that your game is making framerate.
- Yellow means your game is running at half rate (each submitted frame is taking between 1 and 2 vsync intervals to finish).
- Red means your game is taking more than 2 vsync intervals to finish each frame.
- Pink means SteamVR's compositor GPU preemption failed for some reason.
The bottom row is drawn with a gradient color to show passage of time, with the gradient cycling every second.
The numbers give additional information on frame times, how the game is submitting frames, and information on power usage.
First line: "G:" is average and peak GPU frame time, "C:" is average and peak CPU frame time, "[xx]" is the target game loop framerate (which might be the display refresh rate, or an integer divisor of it when the game is not making framerate), "aaaaxbbbb" is the resolution of the per-eye images submitted by the game. Note that the average frame times are expressed in frames per second, unless the game renders fast enough and the display switches to reporting the value in milliseconds.
Second line: the first number is how much time SteamVR's compositor is using per frame in milliseconds, the "@" second number is the current frequency of the GPU in MHz, the "xxW" third number is the average power draw over the past two seconds in Watts.
Third line (may be on the first line in older versions): "Dxx" indicates the format of depth textures submitted by the game when applicable, "Mxx" indicates the format of motion vectors textures submitted by the game when applicable, "skip" indicates the number of frame discontinuity detected in app poses (these events will skip motion smoothing for one frame).
Performance Recording
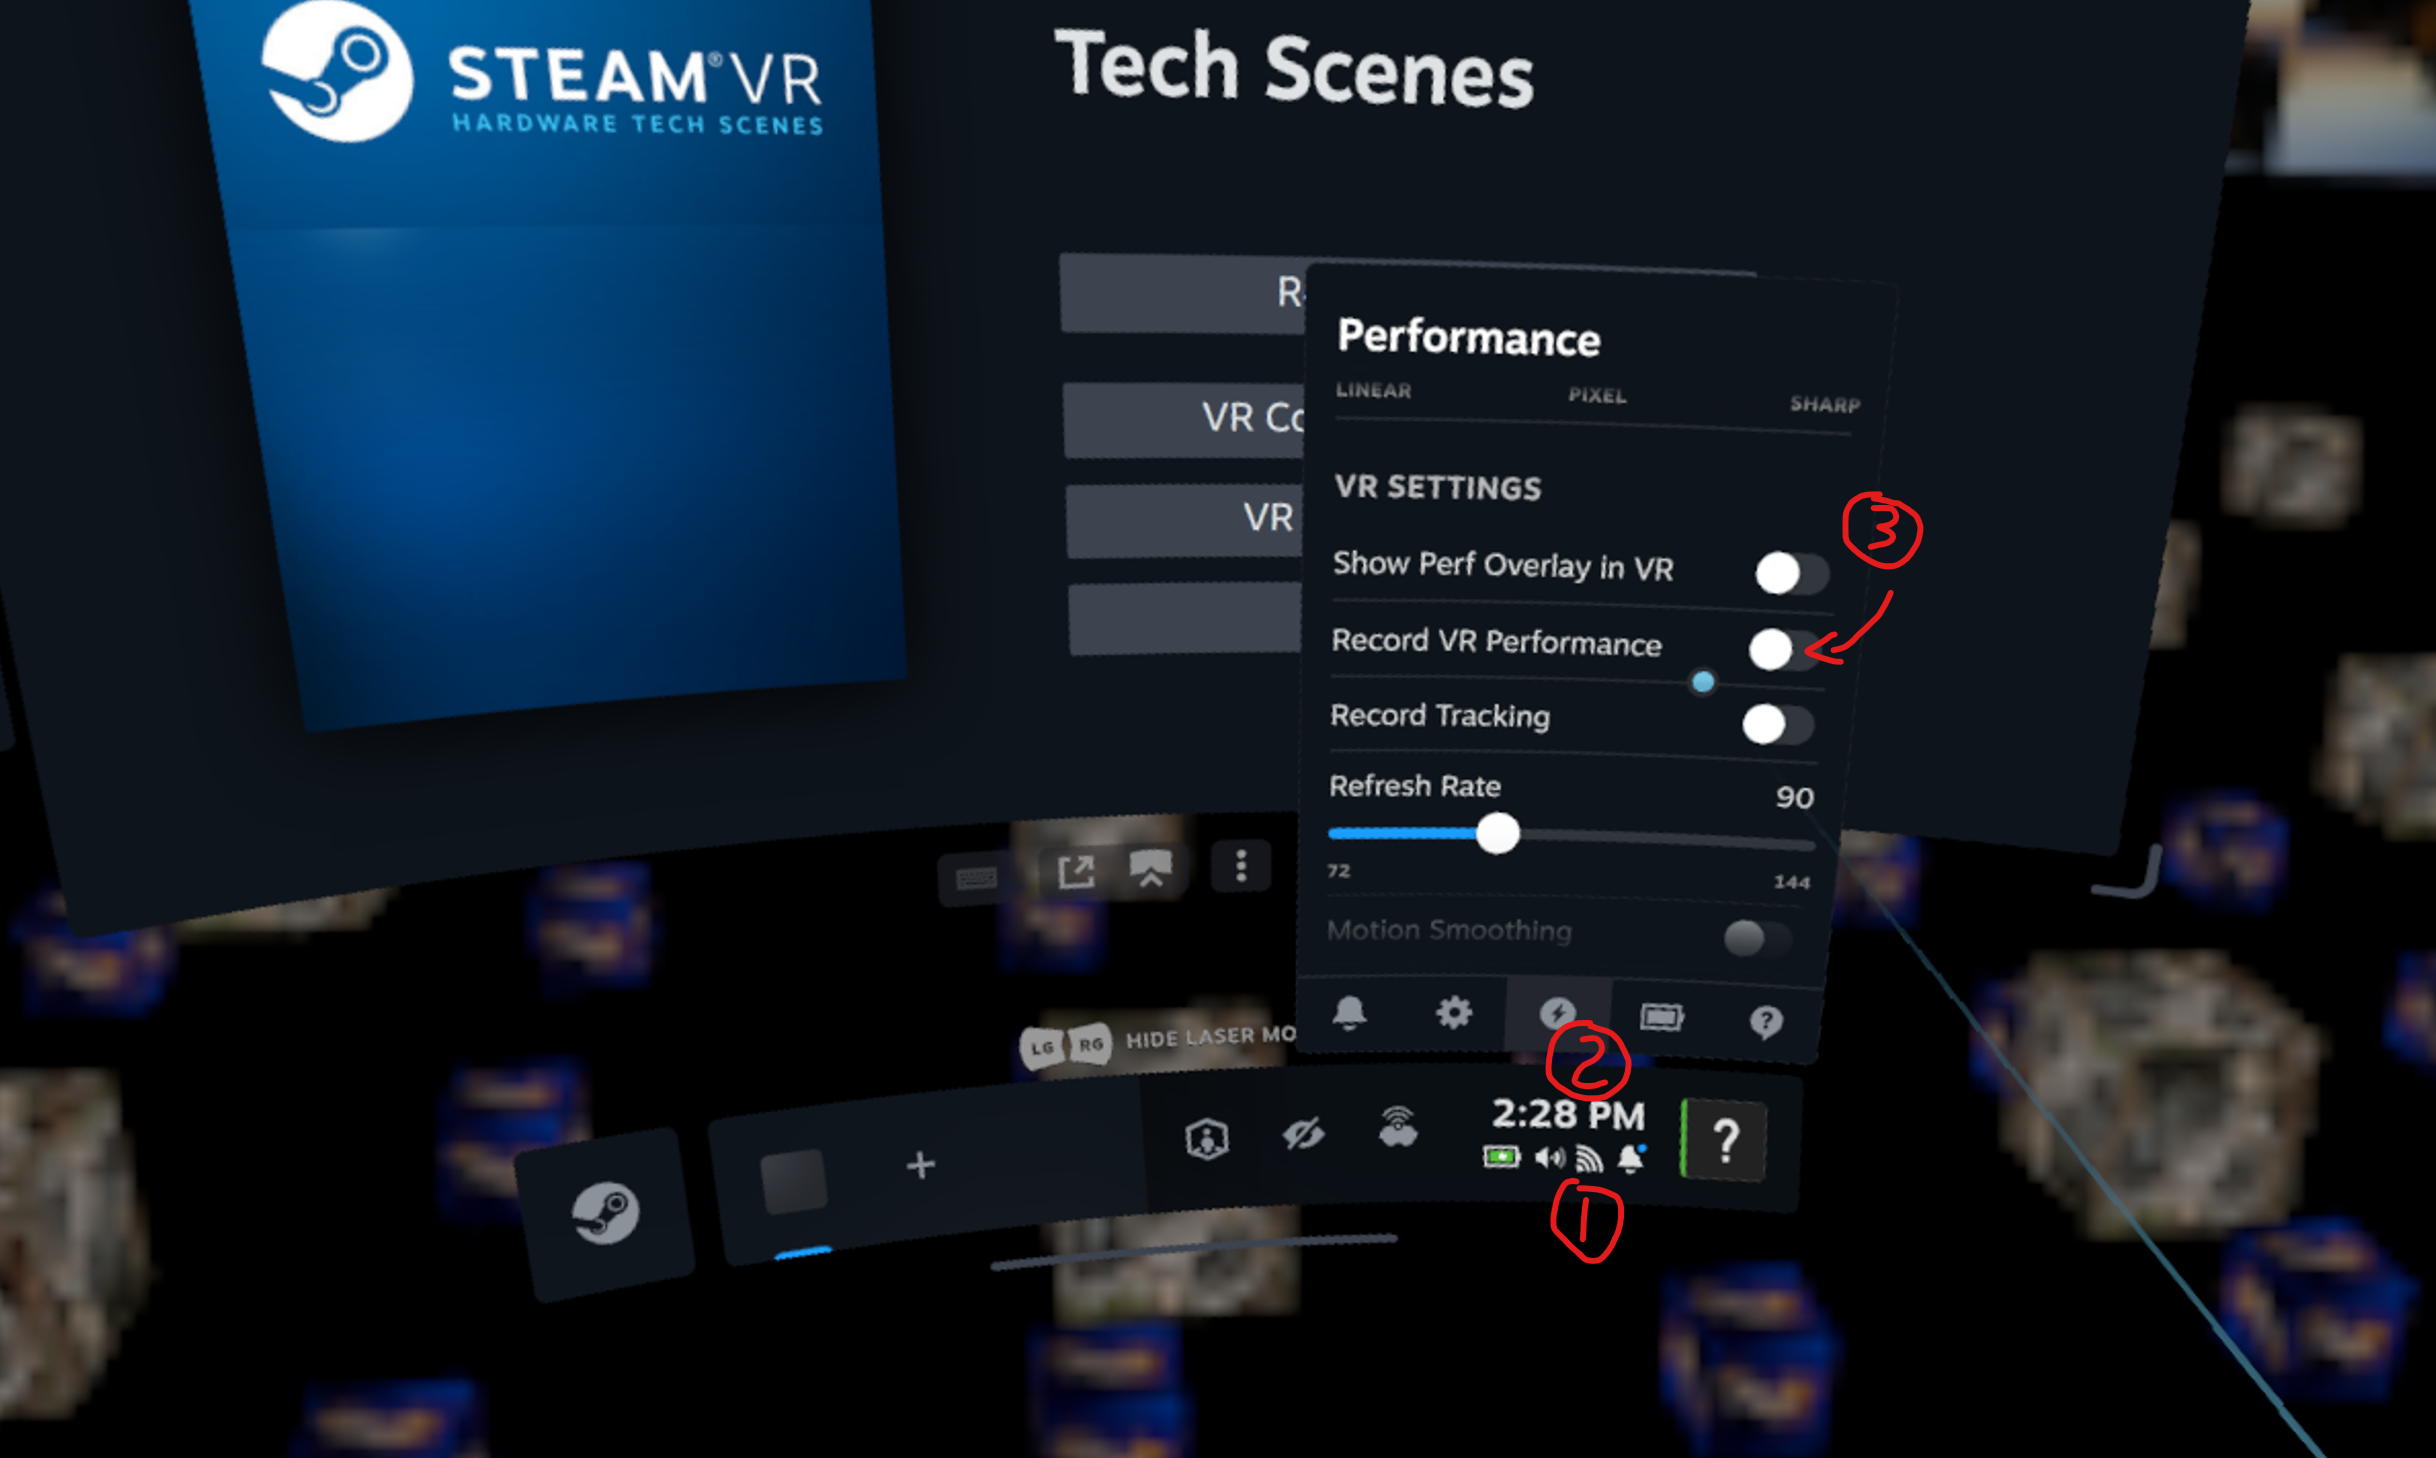
Some of the key metrics from the Performance Graph can be saved to a file. This feature can be toggled from the Quick Access Menu: click the Clock button in the lower right hand corner of the Dashboard, then the Performance button, scroll down to VR Settings and toggle Record VR Performance.The recording is only active when a VR application is running locally. Files are stored in the SteamVR Logs folder (/home/steamos/.local/share/Steam/logs, or accessible through the alias cdl from a shell) with a prefix perfrecording- followed by the Steam application ID and the date/time the recording was initiated (for example: perfrecording-steam.app.445960-2026-09-04_15-16-43.csv). The files are formatted as Comma Separated Values (CSV), with the following metrics available on a periodic interval (sample):
- dashboard: Whether the SteamVR dashboard was visible at any point during the period since the last sample.
- fps: The framerate, corresponding to the actual number of frames submitted by the application.
- peakCpu(ms) and peakGpu(ms): The peak CPU and GPU frame times, in milliseconds, corresponding to the maximum time the application took to submit a frame.
- reprojected: The number of frames reprojected by the SteamVR Compositor. These events occur when the application frame times are too high, or the application is being throttled (for example via SteamVR Settings for the application or when using SteamVR Motion Smoothing).
- peakGpu(MHz): The peak GPU clock, in Megahertz.
- peakPower(W): The peak total system power, in Watts.
- refresh(Hz): The headset's refresh rate (as set by the user in the SteamVR Settings for the application).
- throttle: The frame limit, either set by the user through SteamVR Settings for the application, or by SteamVR when Motion Smoothing is active.
- width and height: The minimum resolution of any frame submitted by the application during the period since the last sample.
The top part of the CSV file also contains a summary:
- appId and appName: The Steam application ID and application name.
- totalFrames: The total number of frames submitted by the application during the recording.
- reprojectedFrames: The total number of frames reprojected by the SteamVR Compositor during the recording.
- framesWithDepth: The number of frames submitted by the application that included a Depth Buffer.
- framesWithMotionVectors: The number of frames submitted by the application that included a Motion Vectors Buffer.
- minResolution and maxResolution: The absolute minimum and maximum resolutions observed during the recording.
Depth and Motion Vectors
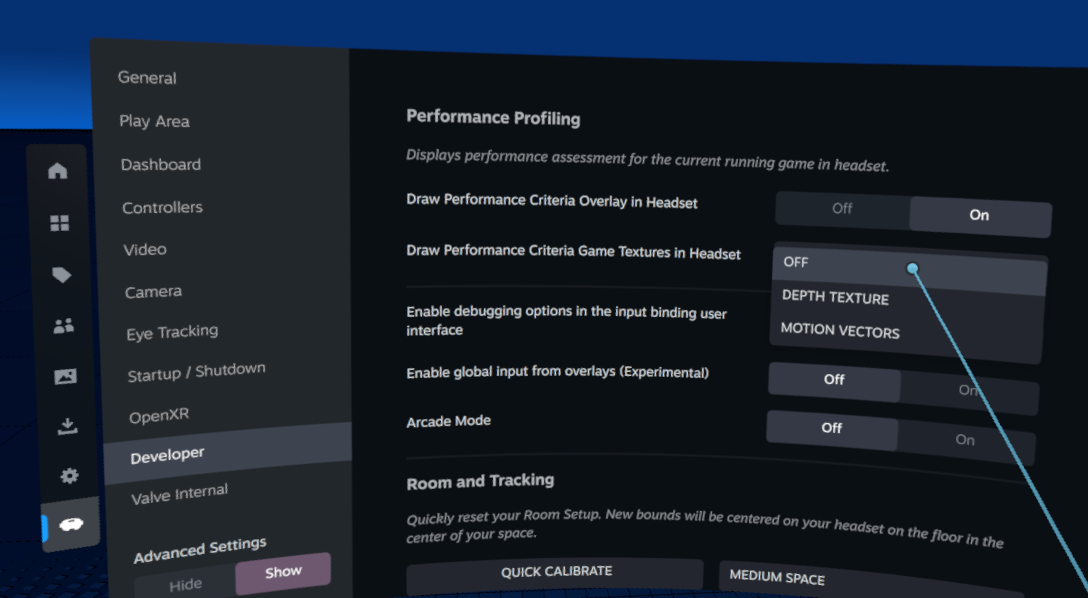
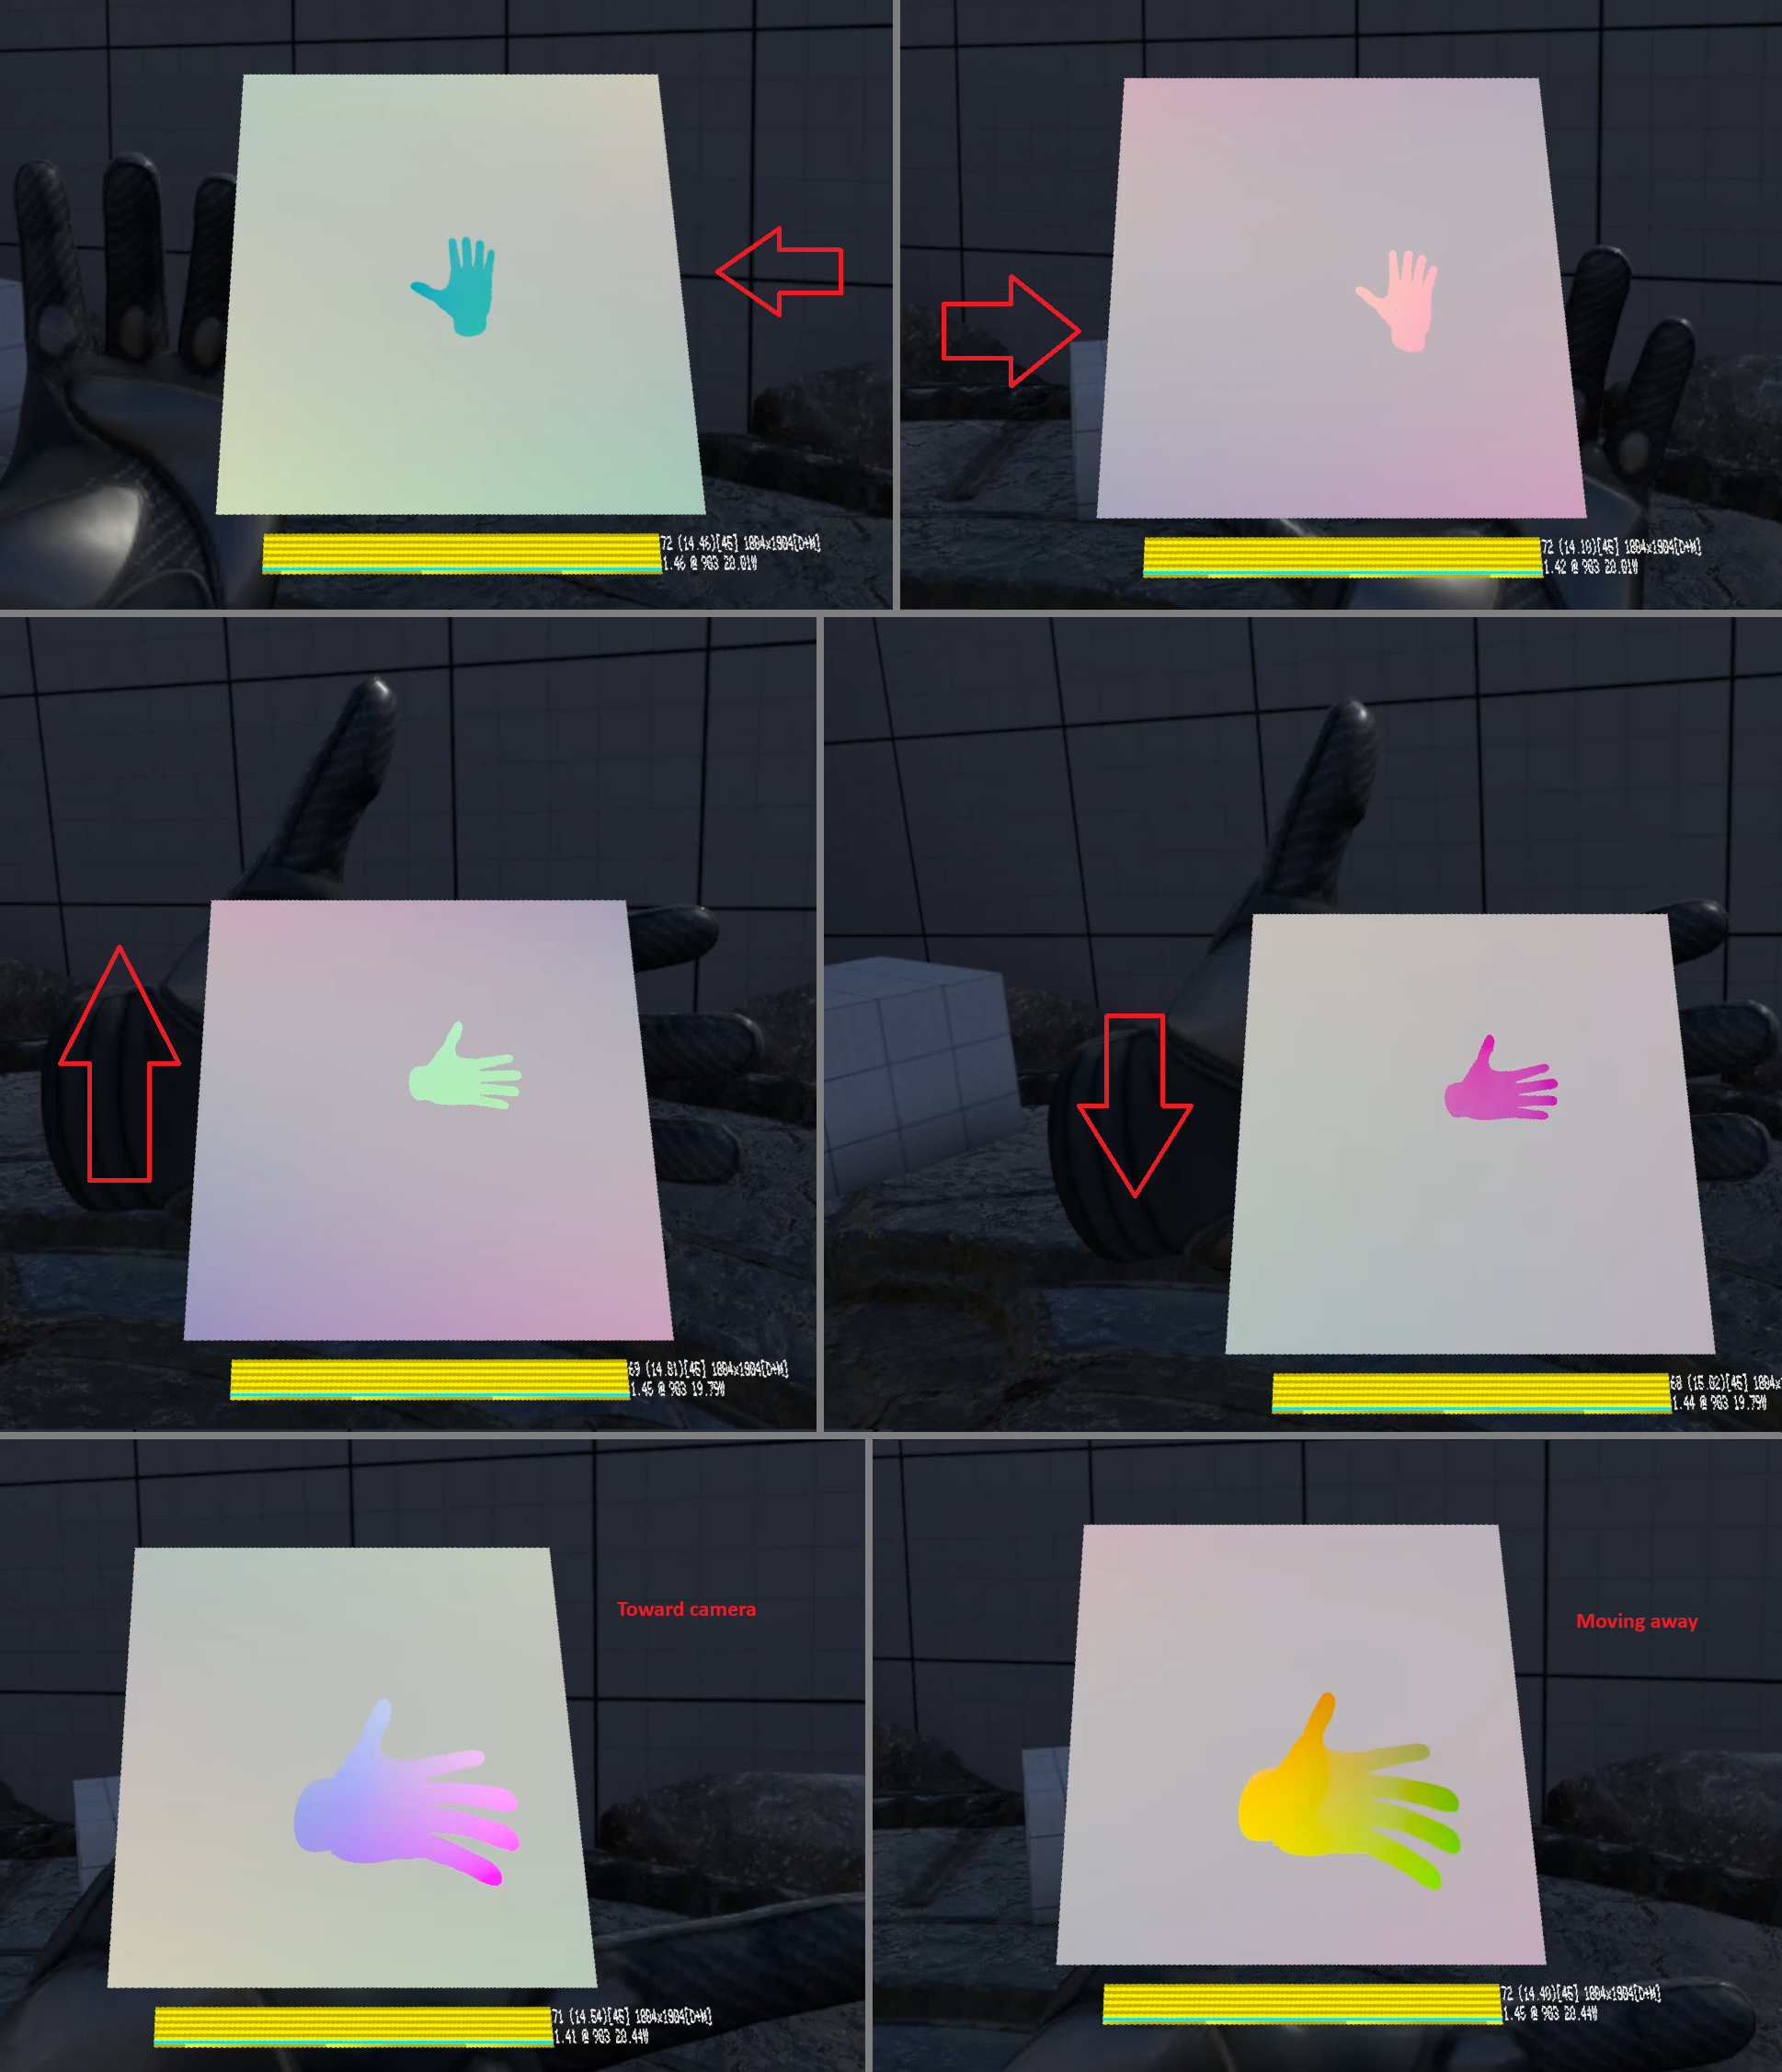
To validate depth and motion vectors submitted by your game, navigate to VR Settings > Developer and select from the Draw Performance Criteria Game Textures in Headset drop-down.Remote Desktop
After enabling Developer Mode, you can access a Linux desktop environment on Steam Frame using Remote Desktop. Windows includes an application called Remote Desktop Connection. VNC and similar programs will also work.To connect, open up Remote Desktop Connection in Windows, and enter frame as the Computer.
Once connected, you’ll see an XRDP login screen. Xorg should be the default session, the username is steamos and the password is whatever you had previously set in Developer Mode settings.
SSH and ADB
After enabling Developer Mode, you can ssh into the headset using the default user steamos and whatever password you had set under Developer Mode settings:ssh steamos@frame
Alternatively, you can adb into the headset by plugging the headset directly into your PC with a USB cable. If you do not have adb already installed, you can install it as part of the Android SDK Platform Tools. Note that adb can also be used to connect to lepton instances. Once it is installed, you can connect to your device with:
adb shell
Once connected to headset there are a variety of helpful commands for you to use:
- cdd - This will change your directory to a location that contains a bunch of helpful Steam Frame scripts.
- cdl - This will change your directory to the Steam Logs directory.
- lepton - Lepton is the name of our Android compatibility layer. You'll often need to specify a lepton instance, which if you're running Lepton Development from your Steam Library will be "dev". Just run "lepton" to get a description of the commands you can run. To get a color-coded logcat you can run "lepton dev logcat".
- sudo pacman - Pacman is the Arch package manager. You can search for packages with "sudo pacman -Ss packageName". You can run "sudo pacman -S packageName" to install a package.
- sudo steamos-readonly disable - By default the filesystem is read-only, so you won't be able to run things like pacman. To make it writable you can run this command. Most any changes you make will be overwritten the next time you update the OS.
Core Dumps
If a native application crashes and you get a core dump, you can use GDB to see the call stack where it crashed. After crashing, view the list of core dumps using the command:coredumpctl
This will bring up a list of core dumps available to view, along with their pid numbers. Find the one relevant to you, named after your project, and view the dump by entering the following command, replacing the number with the pid of the dump you want to view:coredumpctl debug 1234
This command will load up the dump, which might take a while. When prompted, hit enter and full symbols will be loaded. To see the stack trace where the crash occurred, enter bt from the GDB command prompt.Lepton
While working with our lightweight android translation layer, Lepton, you have a few different options available to you to help with debugging. You can ssh into the headset and get some command line options. ADB should also work like it would with any other mobile device. That means after connecting over adb you have access to:- adb logcat - Realtime steam of logs from the device
- adb shell - access the android instance's command line
- adb bugreport - Downloads a zip full of crash dumps and logs
RenderDoc with Lepton Development over adb
If you’re developing an Android application the standard Android workflow should be fine with the exception of connecting over adb first. If you’re connecting over wifi make sure your headset is on the same network as your PC.- On HMD: Launch Lepton Development from your Steam Library, and wait for it to finish loading.
- On PC: adb connect frame
- On PC: Open RenderDoc and in the lower left hand corner select the Android 5.x device
- On PC: adb install your app
- On PC: In RenderDoc under Launch Application select the executable path for your app.
RenderDoc
The easiest way to use RenderDoc to capture frames from Windows, Linux, or Android applications on Steam Frame is to connect from your Desktop PC using Remote Desktop and launch RenderDoc directly on the Frame.We recommend using the SteamOS Devkit Tool to upload your application to the device, that will create a Steam entry that you can easily add launch options to.
- Add your title with the SteamOS Devkit Client
- Remote into your Steam Frame using the instructions in the Remote Desktop section above.
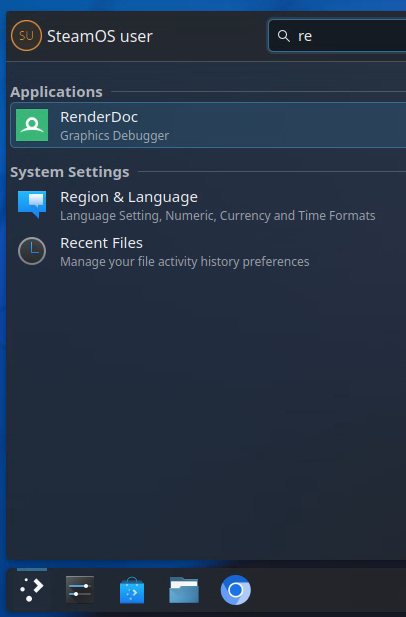
- Then click the Application Launcher in the lower-left, type: renderdoc, and click to launch.
- After launching, you can right-click on the icon and pin it for future ease of access.
- From there you can File > Attach to Running Instance.When running games through Proton, you'll see three wine_preloader instances. Select the last one.
Before your game will show up, you will need to launch it with the renderdoc vulkan layer enabled. This can be done by setting the environment variable ENABLE_VULKAN_RENDERDOC_CAPTURE=1. You can do this in Steam by clicking the app's gear icon and editing the command line to be:
ENABLE_VULKAN_RENDERDOC_CAPTURE=1 %command%
If the capture button is disabled or not working and you see the API listed as Not Presenting you may need to add EnableFrameEndMarkers=1 to your launch options as well (before %command%).
ENABLE_VULKAN_RENDERDOC_CAPTURE=1 EnableFrameEndMarkers=1 %command%
Additional Performance Tools
Additional developer tools for evaluating performance can found here: https://gitlab.steamos.cloud/frame-public/frame-developer-toolsTracking Errors
If you run into serious tracking issues please let us know. Recording a tracking dataset helps us analyze what went wrong so we can address it in future updates. This is a snapshot of the entire tracking state within a window of time. This will let us replay your tracking inputs to see exactly what is happening with hmd and controller poses and test new tracking software against these exact inputs.The recording has to be manually triggered to begin and end, so it's best if the issue is ongoing or if you think you can reproduce the issue without too much effort. Ideally we'd want to see tracking go from working to broken within the capture window so we can see the moment something goes wrong. If tracking recovers, it's also useful to include that recovery in the dataset.
The dataset recording logs a wide variety of sensors on the headset but camera video, screen recording, and audio data is optional. While optional, the more data we have the more likely we will be to be able to diagnose the tracking issue you're recording data for. Additionally, if you include audio data you can talk to the recording to add context.
- Open the VR dashboard, navigate to the Steam overlay, then to VR Settings.
- Enable Advanced Settings if it's not already enabled.
- Go to the Developer settings tab and scroll down to Record Tracking Data.
- Select if you want to include camera/screen/audio data with the dataset.
- Then click START next to Record Tracking Data.
- You should see a recording icon at the top of your view. You can now close the dashboard if you'd like, then reproduce whatever tracking issue you want to capture.
- When you're finished, open the same settings window and click STOP to end the capture.
- Then to get the files you'll want to ssh into the headset: ssh steamos@frame
- Run this command to zip up the latest dataset: zip -r latestDataset.zip "$(ls -td /home/steamos/.config/openvr/config/cv/xrservice/datasets/ | head -n 1)"
- Exit ssh (just type exit)
- Download the zip from your headset into your current directory with scp: scp steamos@frame:/home/steamos/latestDataset.zip
- Then upload to your favorite file host and email us a link to the file.
Android Mesa Debug
If you want to install the mesa debug drivers to get access to lower level debugging you can do this via ssh.- ssh into your Steam Framessh steamos@frame
- Verify current Mesa versionmesa_version(should report something like Mesa 25.3.0-devel (git-8d3763730d)
- Make the filesystem writablesudo steamos-readonly disable
- Install debug mesa with pacmansudo pacman -S deckard-mesa-android-aarch64-debug