Skip to content
Closed
Changes from 1 commit
Commits
File filter

Filter by extension

Filter by extension

Conversations
Failed to load comments.
Loading
Jump to
Jump to file
Failed to load files.
Loading
Diff view
Diff view
Prev Previous commit
Next Next commit
improve terminology and docstring
  • Loading branch information
sawyerbfuller committed Nov 21, 2021
commit c008083c81f25bff16e14ea1c9f62885f8097729
40 changes: 23 additions & 17 deletions control/freqplot.py
Original file line number Diff line number Diff line change
Expand Up @@ -522,8 +522,8 @@ def gen_zero_centered_series(val_min, val_max, period):
'nyquist.mirror_style': '--',
'nyquist.arrows': 2,
'nyquist.arrow_size': 8,
'nyquist.indent_radius': 1e-6,
'nyquist.infinity_radius': 10,
'nyquist.indent_radius': 1e-3,
'nyquist.maximum_magnitude': 5,
'nyquist.indent_direction': 'right',
}

Expand Down Expand Up @@ -594,8 +594,9 @@ def nyquist_plot(syslist, omega=None, plot=True, omega_limits=None,
arrow_style : matplotlib.patches.ArrowStyle
Define style used for Nyquist curve arrows (overrides `arrow_size`).

infinity_radius : float

maximum_magnitude : float
Magnitude/radius at which to draw contours whose magnitude exceeds
this value.

indent_radius : float
Amount to indent the Nyquist contour around poles that are at or near
Expand Down Expand Up @@ -684,8 +685,8 @@ def nyquist_plot(syslist, omega=None, plot=True, omega_limits=None,
'nyquist', 'indent_radius', kwargs, _nyquist_defaults, pop=True)
indent_direction = config._get_param(
'nyquist', 'indent_direction', kwargs, _nyquist_defaults, pop=True)
infinity_radius = config._get_param(
'nyquist', 'infinity_radius', kwargs, _nyquist_defaults, pop=True)
maximum_magnitude = config._get_param(
'nyquist', 'maximum_magnitude', kwargs, _nyquist_defaults, pop=True)

# If argument was a singleton, turn it into a list
if not hasattr(syslist, '__iter__'):
Expand Down Expand Up @@ -771,13 +772,13 @@ def nyquist_plot(syslist, omega=None, plot=True, omega_limits=None,
# Compute the primary curve
resp = sys(contour)

# compute infinity radius contour
# compute large radius contour where it exceeds
# fill with nans that don't plot
infinity_contour = np.full_like(contour, np.nan + 1j * np.nan)
large_mag_contour = np.full_like(contour, np.nan + 1j * np.nan)
# where too big, use angle of resp but specifified mag
too_big = abs(resp) > infinity_radius
infinity_contour[too_big] = \
infinity_radius *(1+isys/40) * np.exp(1j * np.angle(resp[too_big]))
too_big = abs(resp) > maximum_magnitude
large_mag_contour[too_big] = \
maximum_magnitude *(1+isys/20) * np.exp(1j * np.angle(resp[too_big]))

# Compute CW encirclements of -1 by integrating the (unwrapped) angle
phase = -unwrap(np.angle(resp + 1))
Expand Down Expand Up @@ -806,23 +807,27 @@ def nyquist_plot(syslist, omega=None, plot=True, omega_limits=None,

# Save the components of the response
x, y = resp.real, resp.imag
x_inf, y_inf = infinity_contour.real, infinity_contour.imag
x_lg, y_lg = large_mag_contour.real, large_mag_contour.imag

# Plot the primary curve
p = plt.plot(x, y, '-', color=color, *args, **kwargs)
c = p[0].get_color()
ax = plt.gca()
_add_arrows_to_line2D(
ax, p[0], arrow_pos, arrowstyle=arrow_style, dir=1)
# plot infinity contour
plt.plot(x_inf, y_inf, ':', color='red', *args, **kwargs)
# plot large magnitude contour
p = plt.plot(x_lg, y_lg, ':', color='red', *args, **kwargs)
_add_arrows_to_line2D(
ax, p[0], arrow_pos, arrowstyle=arrow_style, dir=1)

# Plot the mirror image
if mirror_style is not False:
p = plt.plot(x, -y, mirror_style, color=c, *args, **kwargs)
_add_arrows_to_line2D(
ax, p[0], arrow_pos, arrowstyle=arrow_style, dir=-1)
plt.plot(x_inf, -y_inf, ':', color='red', *args, **kwargs)
p = plt.plot(x_lg, -y_lg, ':', color='red', *args, **kwargs)
_add_arrows_to_line2D(
ax, p[0], arrow_pos, arrowstyle=arrow_style, dir=-1)

# Mark the -1 point
plt.plot([-1], [0], 'r+')
Expand Down Expand Up @@ -856,8 +861,8 @@ def nyquist_plot(syslist, omega=None, plot=True, omega_limits=None,
ax.set_xlabel("Real axis")
ax.set_ylabel("Imaginary axis")
ax.grid(color="lightgray")
ax.set_xlim(-infinity_radius*1.1, infinity_radius*1.1)
ax.set_ylim(-infinity_radius*1.1, infinity_radius*1.1)
ax.set_xlim(-maximum_magnitude*1.1, maximum_magnitude*1.1)
ax.set_ylim(-maximum_magnitude*1.1, maximum_magnitude*1.1)

Copy link
Copy Markdown
Contributor

Choose a reason for hiding this comment

The reason will be displayed to describe this comment to others. Learn more.

The plot limits are really tied to the maximum_magnitude now. Even for systems like this:

from control import TransferFunction, nyquist_plot
G = TransferFunction([1],[500, 500, 0])
nyquist_plot(G)
Before After
Figure_1_before Figure_1

Is that desired?

Copy link
Copy Markdown
Contributor Author

Choose a reason for hiding this comment

The reason will be displayed to describe this comment to others. Learn more.

I think (though I am not positive) that @bnavigator's system might be a pathological case because you are mostly concerned with systems cascaded with their controllers, in which case you won't have a very low loop gain as this system does.

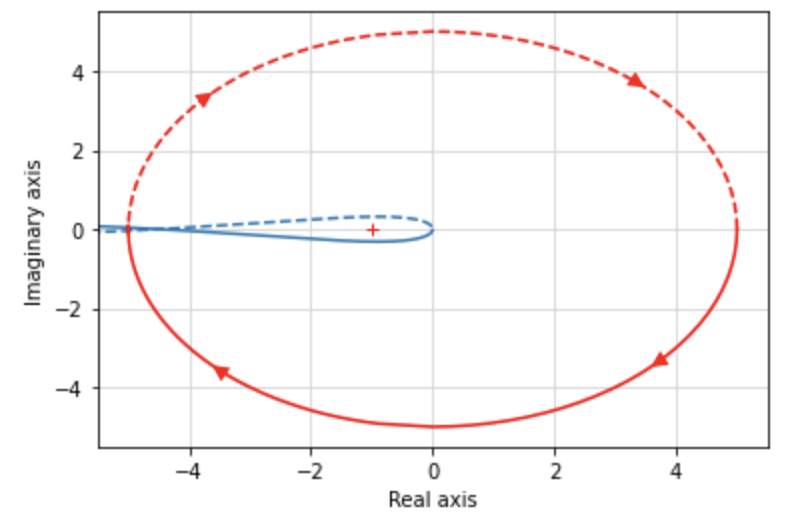
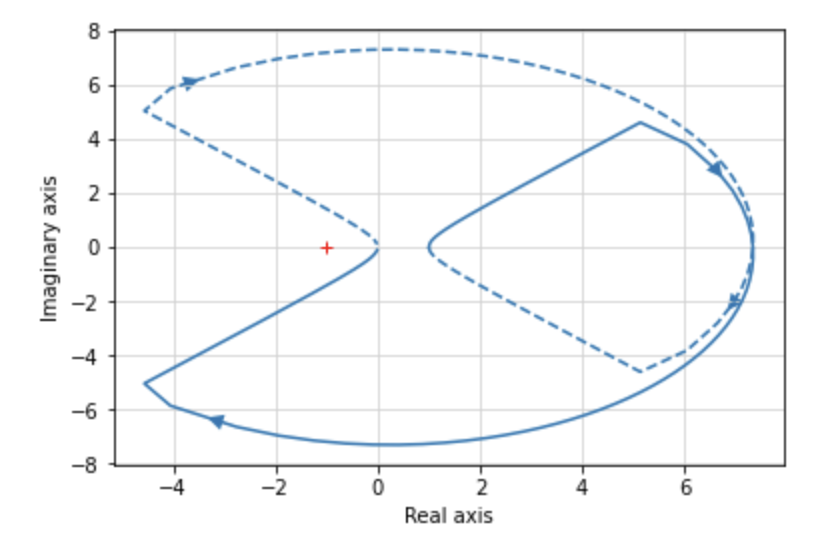
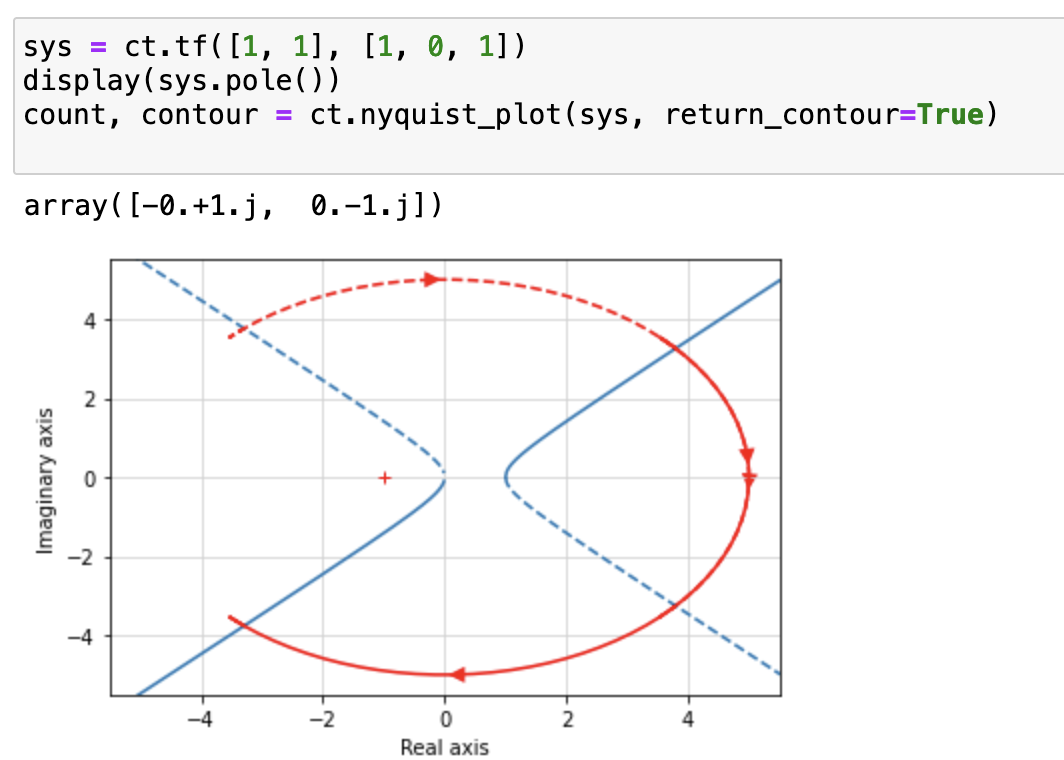
That said, I rewrote the indentation code to add a consistent number of points at every indent, and further reduced the indent radius, which make it so everything but the most extremely low-gain systems have large contours that go outside of the plot window. This also helps with other pathological cases.

also:

  • removed an indent test that confirms that no indentation happens when first omega is too large
  • made the red lines have the same line style as their associated contour.
    Updated after plots:

image

image

And @bnavigator's example:

image

System with poles not at origin:
Before:
image

After:
image

Copy link
Copy Markdown
Contributor

Choose a reason for hiding this comment

The reason will be displayed to describe this comment to others. Learn more.

Okay, bad example.

Let's consider a system without undamped resonance:

In [1]: from control import TransferFunction, nyquist_plot
   ...: G = TransferFunction([0.5],[1, 1, 1])
   ...: nyquist_plot(G)
before after
nyquist_before nyquist_after

Copy link
Copy Markdown
Contributor Author

Choose a reason for hiding this comment

The reason will be displayed to describe this comment to others. Learn more.

Do you think this would be resolved by adding a test for whether there was any maximum_magintude contour drawn, and if there wasn't, then to let it zoom the plot by the default amount?

Copy link
Copy Markdown
Contributor

Choose a reason for hiding this comment

The reason will be displayed to describe this comment to others. Learn more.

Sounds reasonable.


# "Squeeze" the results
if len(syslist) == 1:
Expand Down Expand Up @@ -893,6 +898,7 @@ def _add_arrows_to_line2D(
if not isinstance(line, mpl.lines.Line2D):
raise ValueError("expected a matplotlib.lines.Line2D object")
x, y = line.get_xdata(), line.get_ydata()
x, y = x[np.isfinite(x)], y[np.isfinite(x)]

arrow_kw = {
"arrowstyle": arrowstyle,
Expand Down