Repository navigation
root_locus() plot figure size issue - ipynotebook #464

Description
Activity
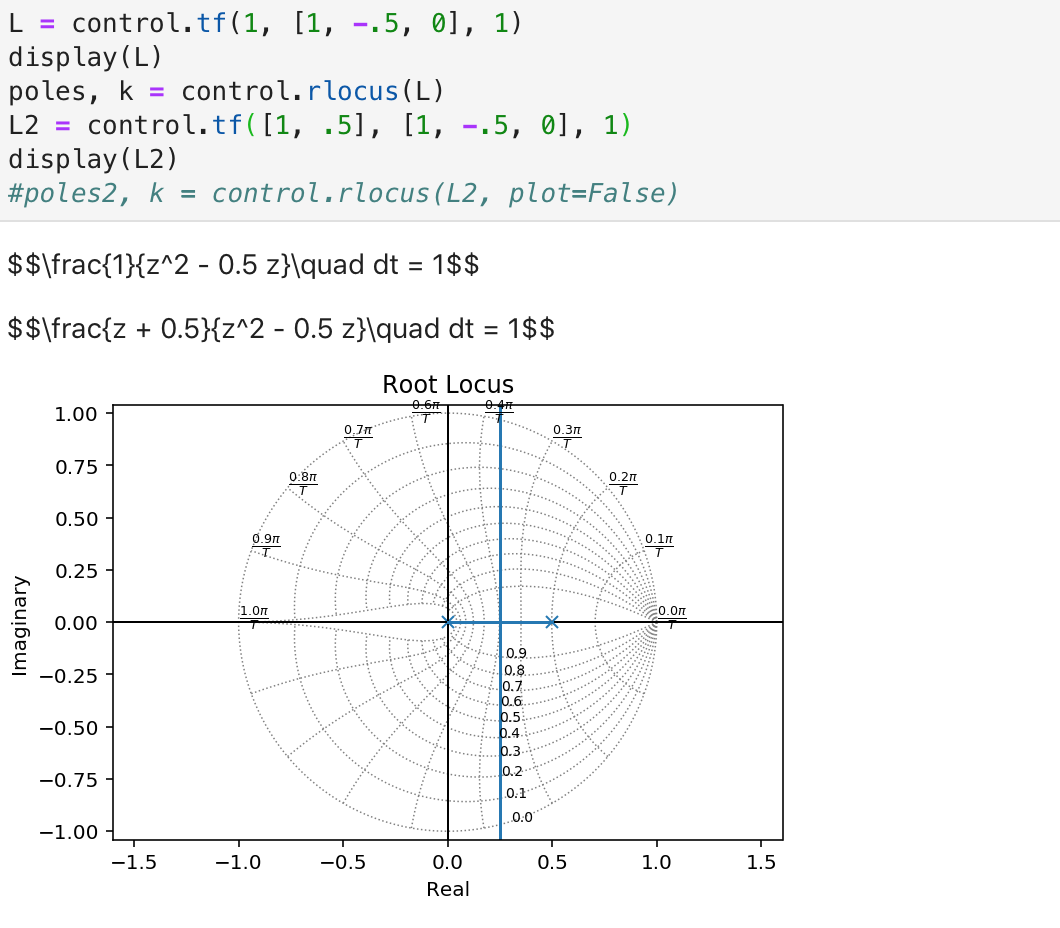
Hi Ricardo, thanks for pointing out the issue. I think this has been fixed in #413 and is now in the dev branch (see screenshot below running the dev branch). Release 0.8.4 is right around the corner and includes these fixes. If you are able to run the dev branch (see instructions near the bottom of https://github.com/python-control/python-control), could you confirm whether or not the issue is still there for you?
Hey Sawyer,
Sorry, I tried finding an issue related to my issue but I didn't find any.. oh well. Awesome to know that!
I did install the dev branch over here and it seems that it's still not ok. Here are some screenshots:
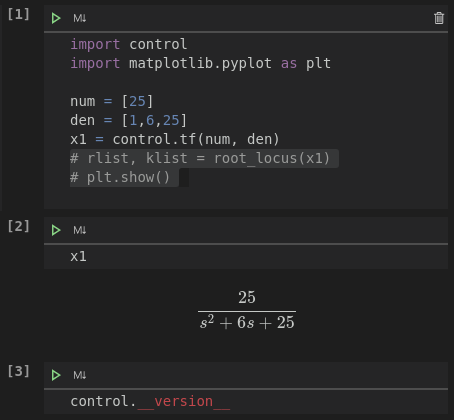
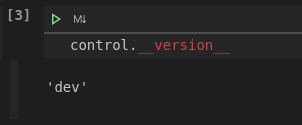
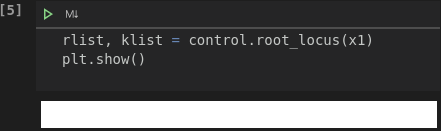
The plot is all white to me.. And it took a little while (longer than usual)
Running your code worked out great:
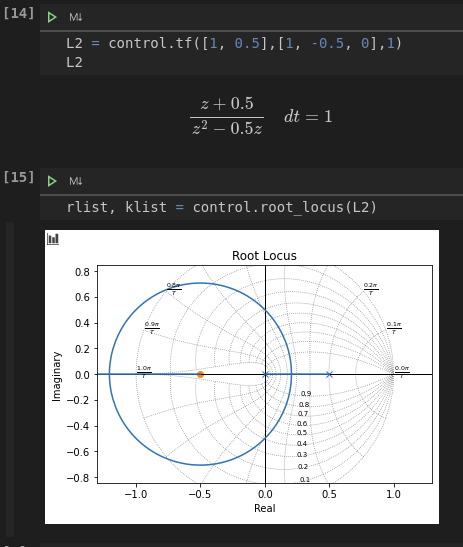
And I tried running the same transfer function (L2) but continuous and I got an error:
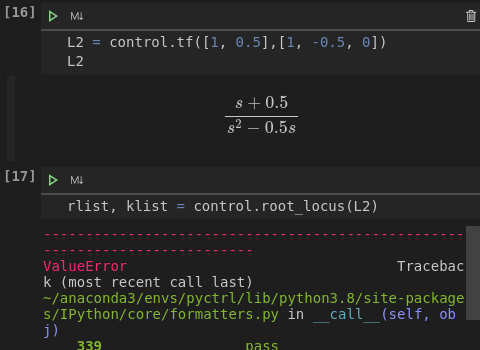
So there seems to be an issue in continuous transfer functions.. Below is the error message I got:
ValueError: Image size of 1932716x278 pixels is too large. It must be less than 2^16 in each direction.
And the full traceback is attached.
traceback.txtConfirming that I get results similar to @RicardoSQueen: when running the code at the top for reproducing the error, I am able to get a plot in ipython but not in a Jupyter notebook. The example that @sawyerbfuller gives works in both cases. This seems to be triggered by something we are doing in
rlocus, but not clear that the fix is anything obvious.I don't think this this is something we can fix prior to release of 0.8.4, so pushing out to 0.9.x for now.
I chased down the problem (with lots of annoying sorting out what uncommented code was doing). The problem boiled down to labels for the constant natural frequency lines being annotated outside of the bounds of the plot. In python/ipython this seems to be handled OK, but in Jupyter notebooks it messes up the aspect ratio of the resulting plot. Final fix was just to check the location version the limits and supress the annotation. PR coming.
Reacted by Ben Greiner and Joseph C. Slater- linked a pull request that will close this issuefix rlocus plotting problem in Jupyter notebooks + comments, PEP8 #503
on Jan 9, 2021


Hello,

I'm currently running python-control 0.8.3 on python 3.8.5.
When plotting 'root_locus' in a interactive python notebook, I get a plot way offset to the right, according to the image below:
The unexpected for me, though, is that when the exact same code was executed directly from the terminal, the plot was perfect.
The plot issues appears on every interactive notebook environment: jupyter notebook, jupyter lab and visual studio code's jupyter implementation. I'm running these versions of jupyter:
notebook 6.1.4
jupyter_client 6.1.7
jupyter_contrib_core 0.3.3
jupyter_core 4.6.3
jupyter_latex_envs 1.4.6
jupyterlab 2.2.8
jupyterlab_pygments 0.1.2
jupyterlab_server 1.2.0
here is the code for reproducing: