Repository navigation
Width/height ratios not obeyed in complex plots with extra space #221
Description

Description
Setting share=0 in plot.subplots leads to (some) axes having non-equal width.
Steps to reproduce
Before using share=0 everything looks good, the axes in the middle row have the same width:
import numpy as np
import proplot as plot

# simple function to extract axis widths
def get_widths(axs):
    return np.array([ax.get_position().bounds[2] for ax in axs])

# plot geometry
array = [[1, 1, 1, 2, 2, 2],
         [3, 3, 4, 4, 5, 5],
         [6, 6, 7, 7, 8, 8]]

# axis in the second row is the reference
fig, axs = plot.subplots(array, hratios=(2, 2, 2.5), ref=5)

# check the widths
widths = get_widths(axs[2:5])
print(widths)
print('all widths equal:', (widths == widths[0]).all())
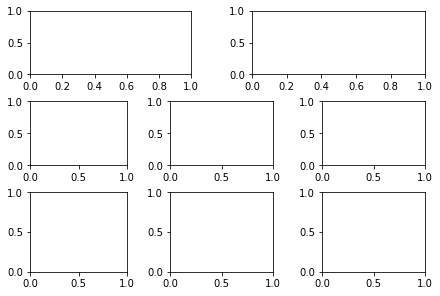
This gives the following figure:

and prints:
[0.29239766 0.29239766 0.29239766]
all widths equal: True
However, when I add share=0 to the plot.subplots - the middle axis in the second row shrinks more than the outer axes:
fig, axs = plot.subplots(array, hratios=(2, 2, 2.5), ref=5, share=0)
checking the widths, I have to call fig.canvas.draw() to get the actual widths, because if the code below is run is the same code cell as the previous I first get widths that are not compatible width what I see in the figure:
widths = get_widths(axs[2:5])
print(widths)
print('all widths equal:', (widths == widths[0]).all())

fig.canvas.draw()
widths = get_widths(axs[2:5])
print(widths)
print('all widths equal:', (widths == widths[0]).all())
which prints:
[0.26041667 0.26041667 0.26041667]
all widths equal: False
[0.2920774 0.2616831 0.2920774]
all widths equal: False
only the widths captured after figure redraw align with what I see in the figure.
But that is not so surprising, the actual issue are the non-equal widths of the axes in the second and third row.
Proplot version
0.6.4
PS. Thanks for the great package, makes creating complex multi-panel figures much easier!
Activity
lukelbd commentedon Jun 30, 2021
Thanks for posting. I've run into this issue before -- extra wspace/hspace in complex plots with overlapping rows/columns seems to invalidate the width and height ratios.
For now you can fiddle with
wratiosto try to make the widths match but will take a deep dive into my geometry solver algorithm when I get the chance (maybe when tackling #110).[-]share=0 leads to axes of non-equal widths[/-][+]Width/height ratios not obeyed in complex plots with extra space[/+]mmagnuski commentedon Jul 6, 2021
🎉
lukelbd commentedon Jul 6, 2021
For future reference below are your examples with axis sharing turned off and on, plus a simple example from the proplot documentation, after this fix.
The new behavior is correct. With the default of "equal" width ratios, proplot should match the portions of subplot widths that don't cross over spaces. In your example, the width of the "left" column (0.6 in x-axis units, if you compare the top-left subplot with the one below it) is equal to the width of the portion of the "middle" column excluding that space between the two upper columns (0.3 x-axis units of the top-left subplot, and 0.3 of the top-right subplot). This is easier to see in the 3-subplot proplot example -- the bottom subplot spans between 0.5 in the top-left subplot and 0.5 in the top-right subplot.
I think this is the "best" default behavior we can get -- if you want to make those 3 columns have identical width, you'll need to tweak
wratios.Fix issues with show_(cmaps|cycles) due to padding fix (#221)
Yefee commentedon Oct 3, 2022
@mmagnuski Any good way to tweak the wratios to make them equal?
mmagnuski commentedon Feb 1, 2023
Hi @lukelbd,
sorry that I respond here so long after the issue was closed. I have trouble understanding what exactly is "the new behavior" that you are referring to, Do you mean that when calculating axis size proplot ignores parts that co-occur in x or y dimension with a "blank space" between other axes in the figure? And as a result of this it sees the axes as equal although they are not? I find this very counterintuitive as a default behavior, but I understand this is not intended, but rather an unfortunate consequence of how proplot internals work?
Hi, @Yefee
fortunatelly creating such layouts in pure matplotlib has gotten easier with mosaic plots:
gives equal axis widths and the following plot: