

Best Test Reporting Tools
Written byDominik Szahidewicz


Updated: September 27, 2026View as Markdown
Search test reporting tools and you'll land on the same r/Playwright thread everyone else does. Someone asks how to show automated test results to a PM or a Head of Support without teaching them to read a stack trace. Twelve replies later, nobody's answered the actual question. Instead: set up Allure. Or wire InfluxDB to Grafana. Or point PostgreSQL at Grafana and build your own panels. Or self-host ReportPortal. Or try the Microsoft dashboard.
Those are all test reporting tools or reporting setups—they generate and present the results of automated test runs—but they differ a lot in who they actually work for. Some are built for engineers debugging failures. Others are better suited to small SaaS and web teams, product managers, support leads, and other non-technical stakeholders who need clear pass/fail visibility without coding knowledge.
Notice what every single one of those has in common: you build it, and then you own it, forever.
That's the part the thread skips. The question was never "which tool has the prettiest dashboard." It's "who's going to keep this thing running in six months when the person who set it up moves teams." This comparison looks at the test reporting tools that come up most often—including options like Allure, ReportPortal, Testmo, and BugBug—through the factors that actually change the decision: maintenance overhead, framework integration, technical accessibility, and how well each tool communicates results to engineers versus everyone else. Here's what each option actually costs to run, and when the honest answer is a tool built for non-engineers instead of a reporting layer bolted onto one built for engineers.
If you just need the shortlist: Allure or ReportPortal if your team already owns a Playwright/Selenium suite and can host a service. Testmo if you want test case management and automation reporting in one paid, hosted tool. Playwright's built-in HTML reporter if the only audience is the person who wrote the tests; it fills a similar role to a default TestNG HTML report, as a framework-native output that shows results for the person who ran the suite rather than polished stakeholder reporting. And a managed platform with plain-language execution history — BugBug is one — if the person who needs the report doesn't write code and shouldn't have to ask someone who does.
| Tool | What it actually is | Who maintains it | Can a PM read it unassisted? | Entry price |
|---|---|---|---|---|
| Playwright HTML reporter | Built-in, local or CI-artifact report | Whoever owns the CI config | No — screenshots and traces, not context | Free (built into Playwright) |
| Allure Report | Self-hosted report generator + history | You (server, storage, upgrades) | Only with explanation | Free, open source |
| ReportPortal | Self-hosted analytics platform with ML failure clustering | You (Docker/Kubernetes, DB, upgrades) | No — built for triage, not narration | Free, open source |
| InfluxDB/PostgreSQL + Grafana | DIY metrics pipeline you design yourself | You, from scratch | Only the dashboard you build | Free tools, real build time |
| Microsoft Playwright Testing (now Azure App Testing) | Cloud-hosted Playwright execution + reporting dashboard | Microsoft infra, your Azure bill | Partially — still trace-and-log first | Pay-as-you-go Azure pricing |
| Testmo | Hosted test management + automation reporting | Testmo (vendor-hosted) | Mostly — built for mixed technical/non-technical teams | $99/mo (Team, up to 10 users) |
| BugBug | Managed test automation with plain-language step recordings | BugBug (vendor-hosted) | Yes — steps and screenshots, not stack traces | Free plan, unlimited users |
Allure is a genuinely good reporting tool - it's the top comparison for a reason. It supports multiple programming languages, is widely used across popular testing frameworks, and allure-playwright takes about fifteen minutes to wire into a config file. Run allure generate and you get an interactive HTML report built for report generation; it can generate reports with history, retries, and attached screenshots and traces, plus more detailed reports than most framework-native output.
Best for: engineering teams that already run Playwright or Selenium and want a shared dashboard for the people who write the tests.
Avoid if: the report's audience is someone who doesn't already know what a "flaky retry" or a stack trace means. Allure's own FAQ tells you how to share results with non-technical stakeholders: generate the static HTML and send a link. That link still opens on a page built for debugging, not for answering "did the checkout flow work today." Someone still has to host the results somewhere reports don't vanish after 30 days (GitHub Actions artifacts expire by default), and someone still owns the Java dependency Allure's CLI needs.
They get compared constantly, but they solve different problems.
Allure Report is a report generator. You run it after a suite finishes, and it turns the results into a static, browsable HTML report with history and trends. No server required to view a single report — you can open the file directly. Lightweight, and that's the appeal.
ReportPortal is a running service. You deploy it (Docker Compose or Kubernetes), point your test framework at it, and it ingests results in real time. Its actual differentiator is ML-based failure clustering — it groups similar failures automatically so a large suite's triage doesn't mean reading 400 individual stack traces one at a time, and effective tools use flaky test detection to identify flaky tests statistically.
That matters because flake detection helps separate infrastructure noise from real regressions.
Choose Allure if: you want a report, not infrastructure. Zero ongoing hosting, and it's a smaller lift for a small-to-mid suite.
Choose ReportPortal if: your suite is large enough that manual failure triage is the bottleneck, and you have the appetite to run and patch a self-hosted service indefinitely.
Neither answers the stakeholder question. Both were designed for the person debugging the failure, not the person who needs to know whether they can announce the release. That's not a knock on either tool — it's a different job.
Best for: teams that already run Grafana for infrastructure monitoring and want test metrics on the same pane of glass, with an engineer who has the bandwidth to own a second pipeline.
Avoid if: nobody on the team currently owns a Grafana instance. You're not adopting a reporting tool here — you're building one, and every future "why does this graph look wrong" question routes back to whoever wrote the export script.
This is the answer that shows up in every one of these threads from someone who's clearly done it before, and it's the most honest option on the list about what it actually is: a data engineering project. You export test results to a time-series or relational database, then build Grafana panels on top — pass rate over time, flaky-test trend, and other quality metrics like suite duration and failure concentration by area.
Teams usually use this setup to watch release readiness and defect resolution trends as part of software quality tracking, and to monitor whether testing strategies are actually working.
Worth a specific note here because it changed recently: Microsoft's Playwright cloud service — the one that added a reporting dashboard with trace viewer and screenshot/video artifacts baked in — was retired as a standalone product and folded into Azure App Testing, which now combines Playwright execution with Azure Load Testing under one platform. It’s strongest when teams want CI/CD integration tied closely to existing Microsoft development tools. If a "Microsoft reporting" recommendation shows up in an older thread or guide, check the current Azure docs before you build on it — the product it points to may no longer exist under that name.
Even in its current form, the dashboard is built around trace viewer and CI artifacts — genuinely useful for the engineer troubleshooting a failure, still not something you'd hand to a PM without a walkthrough, and it helps with execution tracking while remaining trace-first rather than stakeholder-first.
Best for: teams that want structured test case management and automation reporting under one roof, with better visibility into testing progress and test coverage across manual and automated work, and are fine paying for it — plans start at $99/month for up to 10 users, moving to $399/month at the next tier.
Avoid if: you only need automation reporting. You'd be paying for test case management you won't use, and it doesn't solve the "no code required to understand this" problem any more directly than a well-configured Allure instance does.
Testmo sits apart from the rest of this list because it's not a reporting layer at all — it's a hosted test management platform (manual test cases, exploratory sessions, automation results) with reporting built in as one feature among several. Hosted platforms like this are most useful when they support CI/CD integration and link automation results back to test cases. If your team runs manual and automated testing side by side and wants one system instead of stitching a test case tool to a separate reporting tool, that combination is the actual pitch. Since 43% of QA teams actively review test reports after execution, centralized reporting inside a test management tool can matter.
Every tool above is legitimate. None of them is wrong. But notice the shape of the decision the thread pushes you toward: pick one, provision it, integrate it with your test automation frameworks or test runners, and keep it patched and running for as long as the team exists. For most QA teams, automated testing is now a core strategy tied directly into CI/CD, with 78% using it that way. That's not a reporting decision — it's a second infrastructure project, and it lands on the same person who already owns the CI config, because they're the only one who can.
That's fine when the report's audience is other engineers working across testing frameworks and reviewing automated tests. Those teams often also care about how the reporting layer fits their automation frameworks. It stops being fine the moment the actual reader is a Head of Support who needs to know if the signup flow is broken before the next customer call, or a PM who wants release confidence without opening a CI log. For that reader, the honest options aren't "which dashboard tool." It's "do we want to own reporting infrastructure at all, or do we want the reporting layer built into how the tests run in the first place."
Non-engineers need structured reporting on test outcomes, not raw test execution data.
This is the same principle behind owning your regression coverage instead of your testing infrastructure — the reporting layer should be something your team reads, not something it maintains.
BugBug records tests by clicking through your app, not writing code, and in the broader context of software testing, its reporting is built into execution instead of bolted on later. Every run produces a plain-language step list with a screenshot at each step - the failure reads as "step 7: expected element not found," not a stack trace, and the platform surfaces test failures in plain language from the underlying test data. Runs can notify a Slack channel or email directly, and every suite keeps a run history in the app, so "did this pass yesterday" is a scroll, not a query. That is especially useful when a test failed once but the team needs context from the surrounding test suite before treating it as a real regression. Flaky tests can account for 16% to 20% of UI tests, which is why readable history matters when a failure appears. None of that requires anyone to host, patch, or maintain a separate reporting service - it's the same platform that runs the tests.
The honest limitation: BugBug runs on Chromium-based browsers only, so if your suite needs Firefox, Safari, or native mobile coverage, you're back to a Playwright- or Selenium-based stack — and at that point, Allure or ReportPortal reporting on top of it makes more sense than trying to force BugBug to cover ground it isn't built for.
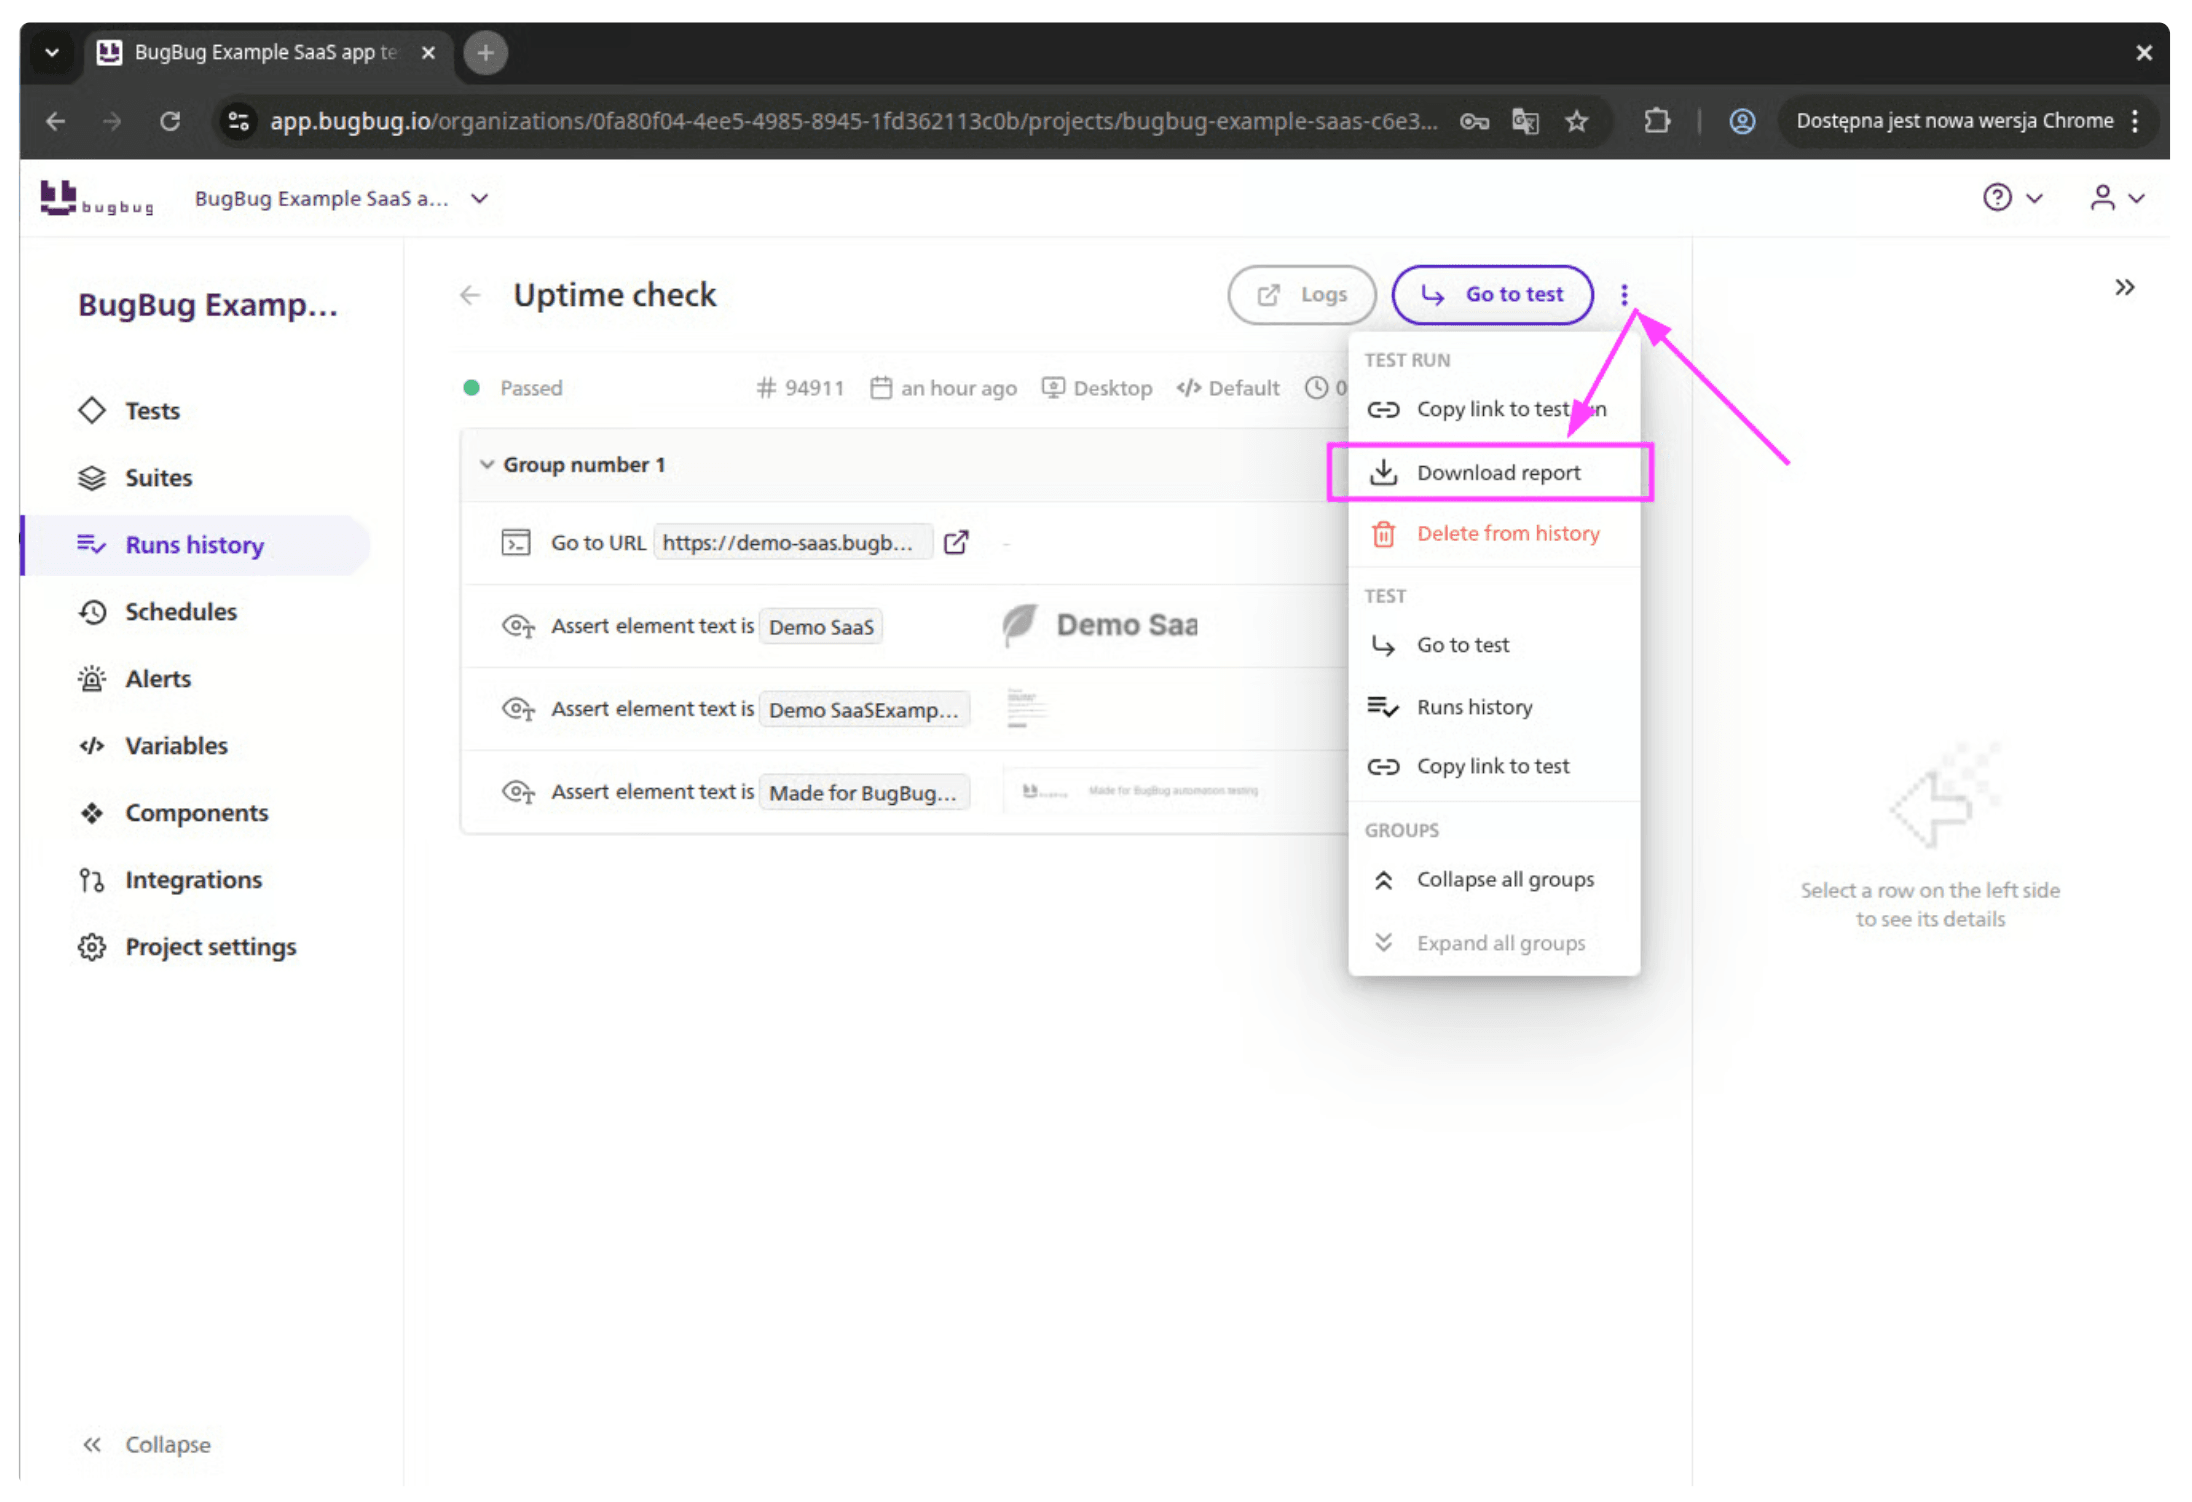
If your team already has engineers running Playwright and the report's audience is other engineers, BugBug isn't the fix - Allure or ReportPortal are the right layer on the stack you already have. If the report's audience includes someone who doesn't write code and shouldn't have to learn to, that's the specific gap BugBug is built to close, and the free plan is unlimited on users and tests, so you can see whether the reports actually work for your Head of Support before deciding anything.
The best automated test reporting tools aggregate test results from test execution across automated testing workflows.
This category also overlaps with needs like api testing and support for different kinds of test environment, but the right reporting tool still depends on who needs the results and how the tests are run.
None of these is a universal winner. The r/Playwright thread wasn't wrong about any single tool — it was just answering "how do I build a dashboard" when the real question was "who reads this, and do I want to be the one maintaining it for them." Answer that first, and the tool choice gets a lot shorter.
Happy (automated) testing!

Your next release. Properly tested.
Join 1,200+ QA teams that automated their
regression coverage with BugBug.


Dominik Szahidewicz is a Software Quality Evangelist specialising in quality assurance, test automation, and modern software testing practices. He creates practical, research-driven content that helps QA professionals, developers, and product teams improve test coverage, automate repetitive testing, and release more reliable web applications.
Drawing on his experience in technical writing, data analysis, and application consulting, Dominik translates complex testing concepts into clear, actionable guidance. His areas of interest include end-to-end testing, no-code test automation, regression testing, and the use of AI in software quality assurance.
Join thousands of QA experts. Subscribe to our newsletter.
Get more testing tips and product related content. Zero spam.
Explore the best websites with bugs for testing in 2026. Practice manual and automation testing on real-world platforms.
Let's dive into the best front-end testing frameworks, whether you need javascript driven platform or codeless solution with friendly user interface.
Explore the best test automation frameworks, strengthen your knowledge, and choose the right option for your business needs with confidence.
Discover the best practices for handling Stale Element Reference Exception in Selenium. Learn how to avoid it in your test automation code.
Discover top Selenium practice websites designed for a variety of testing scenarios. Sharpen your automation skills.


