
The Math Behind Social Distancing



Save to Inbox
The Math Behind Social Distancing
As we wait for scientists and healthcare professionals to develop a vaccine for COVID-19, there is another, more readily available tool at our disposal.
Social distancing, defined as measures taken to reduce physical contact, is the first line of defense for containing an infectious disease like COVID-19. That’s because these infections spread when people cough, sneeze, or touch surfaces on which the virus resides.
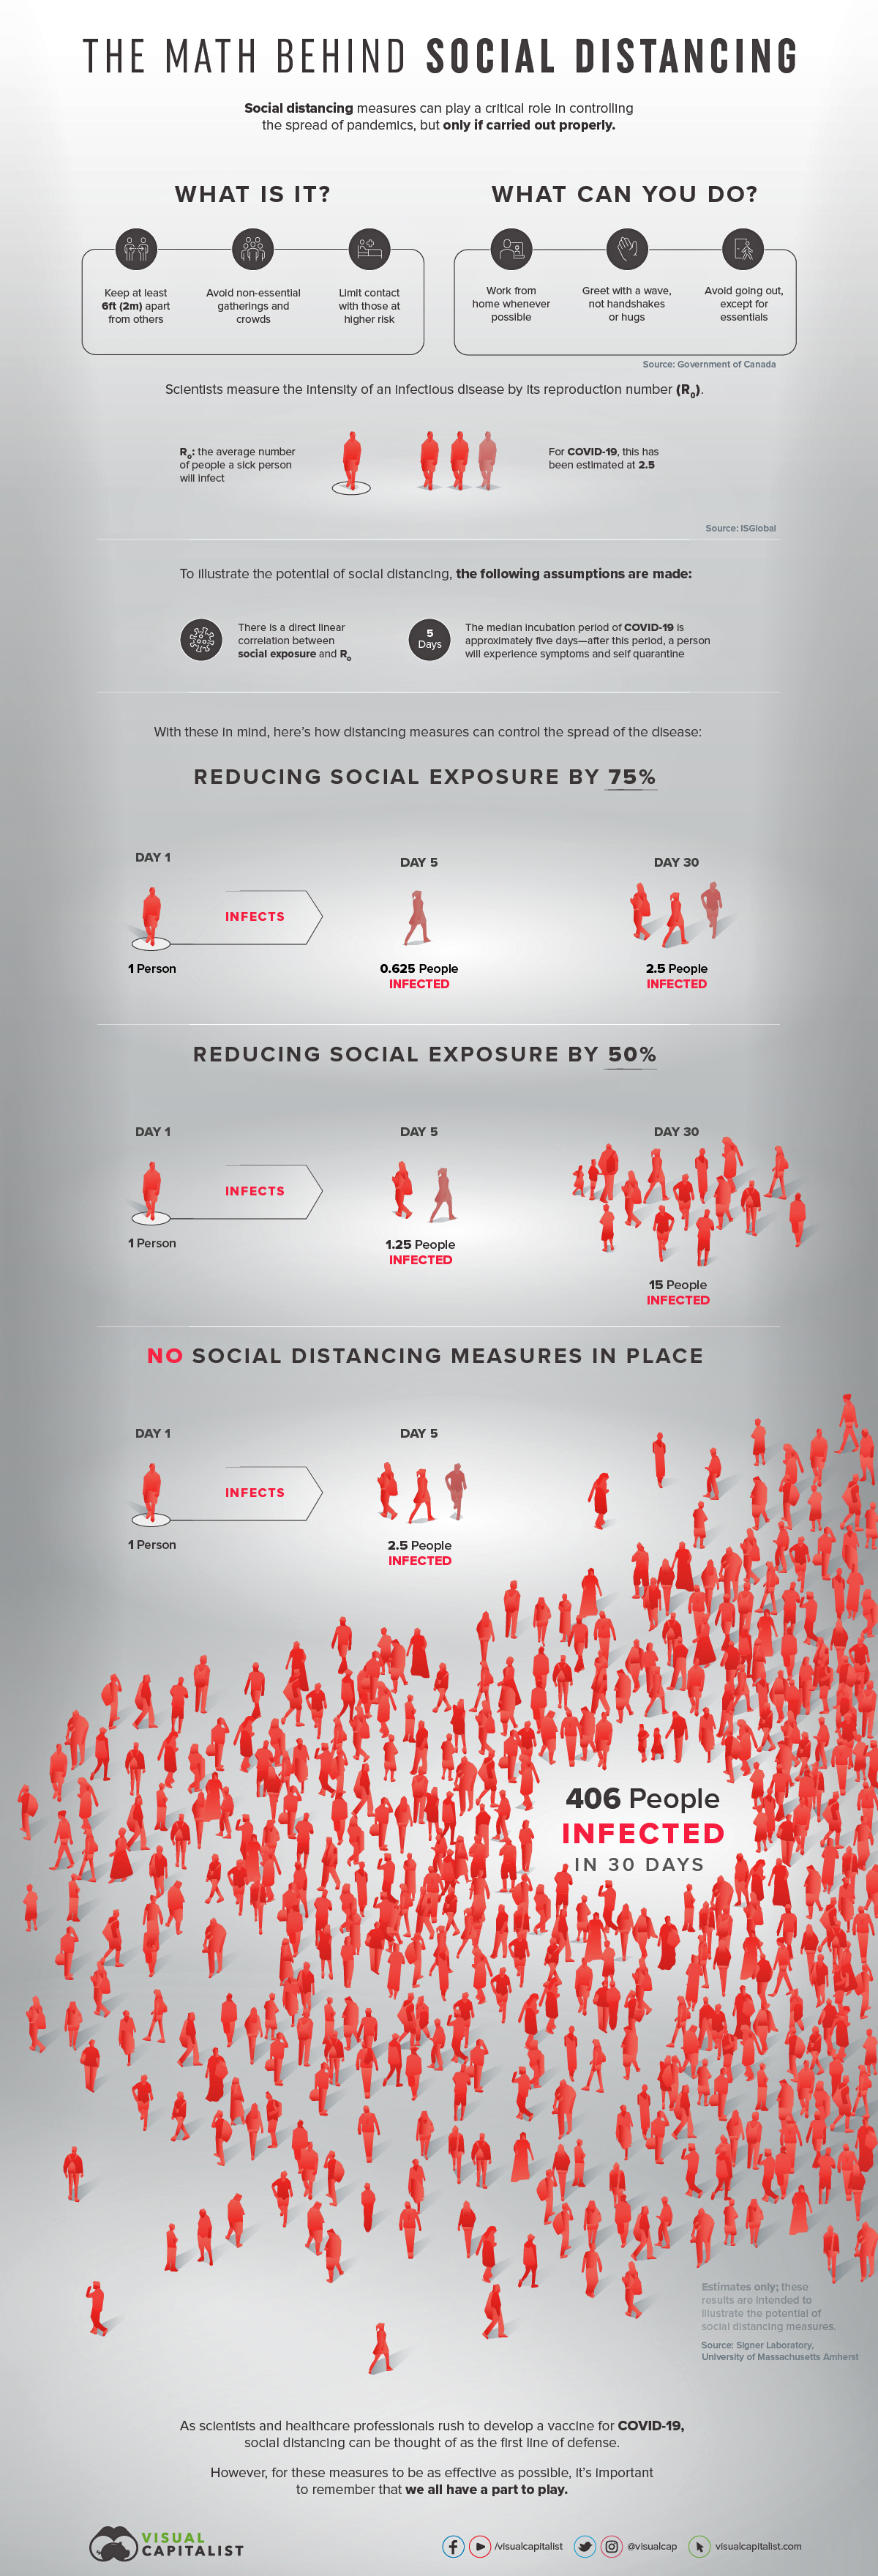
To help us grasp the impact these measures can actually have, today’s infographic illustrates how a reduction in social exposure can theoretically contain the spread of infection.
Theoretical Potential
The calculations used to create today’s infographic come from Signer Laboratory, a stem cell research lab located in the Moores Cancer Center at the University of California San Diego.
Using a summation formula makes it possible to estimate the number of new infections over a 30 day period, across three scenarios.
| Scenario | 5 Day Period | 30 Day Period |
|---|---|---|
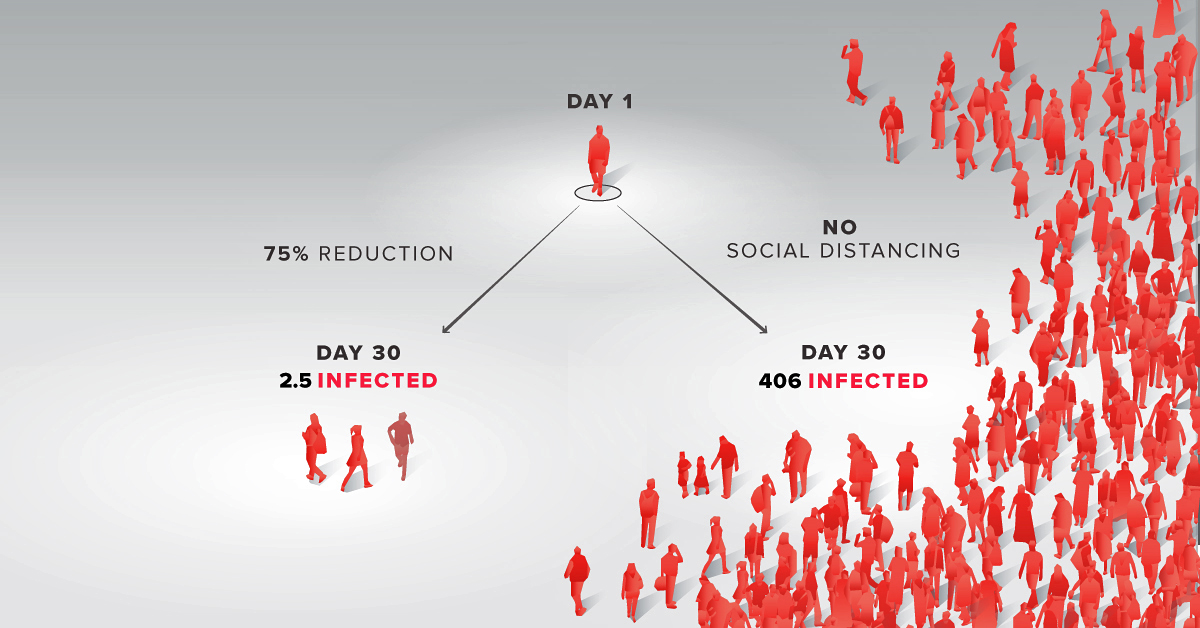
| No social distancing practiced | 1 person infects 2.5* others | 406 people infected as a result |
| 50% reduction in social exposure | 1 person infects 1.25* others | 15 people infected as a result |
| 75% reduction in social exposure | 1 person infects 0.625* others | 2.5 people infected as a result |
*For estimations only. It is not possible to infect only a fraction of another person.
To arrive at the figures reported above, Robert A.J. Signer, Ph.D., and his team made a number of key assumptions.
First, they estimated the basic reproduction number (R0) of COVID-19 to be 2.5, a figure supported by recent research. This means that, on average, an infected individual will spread the disease to 2.5 other people.
Next, they assumed that an infected individual will unknowingly spread COVID-19 over the median five day incubation period. After this period, the individual will begin to develop symptoms, immediately self quarantine, and no longer pose a threat.
Finally, they assumed a direct linear correlation between social interactions and R0. This means that when an infected person reduces their physical contact with others by 50%, they also spread the disease by an amount 50% less.
Timing is Everything
While the figures above are the results of mathematical estimations, researchers have actually studied social distancing from a variety of angles.
One study used simulations to determine the magnitude and timing of social distancing measures required to prevent a pandemic. The distancing measures simulated were:
| Measure | Details |
|---|---|
| School closure | Teachers and students spent weekday daytime cycles at home, rather than at school. |
| Increased case isolation | Upon becoming symptomatic, adults (90%) and children (100%) would self quarantine for the duration of the infection. |
| Workplace non-attendance | Each day, a person had a 50% chance of staying home instead of attending their workplace. |
| Community contact reduction | Individuals reduced their physical contact with community members by half, each day. |
| Combination of all four | All four measures combined. |
The results, for a community of 30,000 people and an epidemic with R=2.5, are charted below. We can define the final illness attack rate as the share of people from an at risk population who ultimately catch the disease.
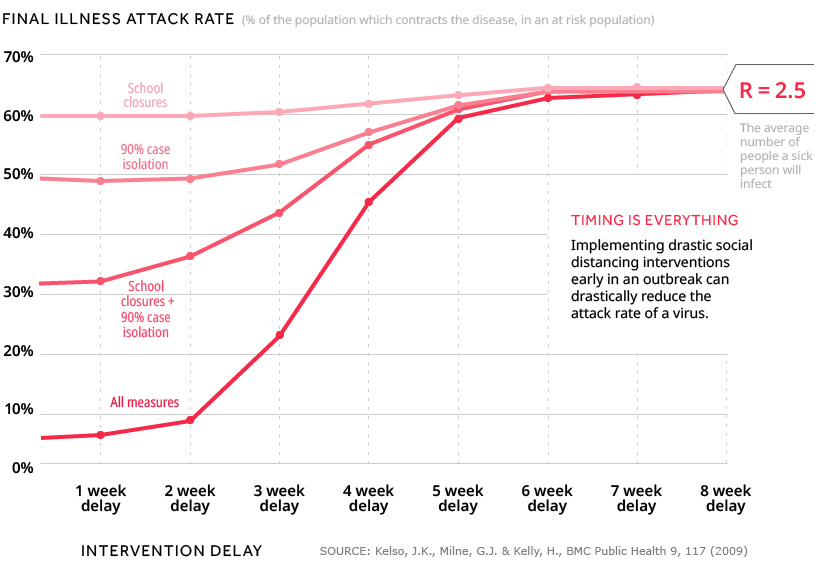
Results showed that when no action was taken, 65% of the population contracted the disease. However, if a combination of all four distancing measures were implemented instead, the attack rates were:
- 45% (distancing begins after a 4 week delay)
- 21% (distancing begins after a 3 week delay)
- 7% (distancing begins after a 2 week delay)
What’s clear is that social distancing was significantly more effective when implemented with minimal delay—the final illness attack rate rose quickest beyond the third week. These findings draw a parallel to the visualizations in today’s infographic, which showed us just how quickly a disease can spread.
Social distancing interventions are important as they represent the only … measure guaranteed to be available against a novel strain of influenza in the early phases of a pandemic.
Kelso, J.K., Milne, G.J. & Kelly, H., BMC Public Health 9, 117 (2009)
We arrive at a similar conclusion when it comes to the types of distancing measures implemented. In the simulations, none of the four measures taken on their own were able to have a similar effect as when they were combined.
We All Have a Part to Play
With the global number of COVID-19 cases still rising, many governments have issued quarantine orders and travel bans.
The math supports these decisions—reducing our physical contact with others, even when we aren’t experiencing any symptoms, is crucial. Studies like the one summarized above also prove that taking action sooner, rather than later, can go a long way in reducing the spread of infection.
The key takeaway from all of this? Social distancing is a powerful disease control tool, but only if we all participate.









The Top Causes of Death in the United States, Ranked
Heart disease, cancer, and accidents dominate mortality trends.

The Top Causes of Death in the United States
See visuals like this from many other data creators on our Voronoi app. Download it for free on iOS or Android and discover incredible data-driven charts from a variety of trusted sources.
Key Takeaways
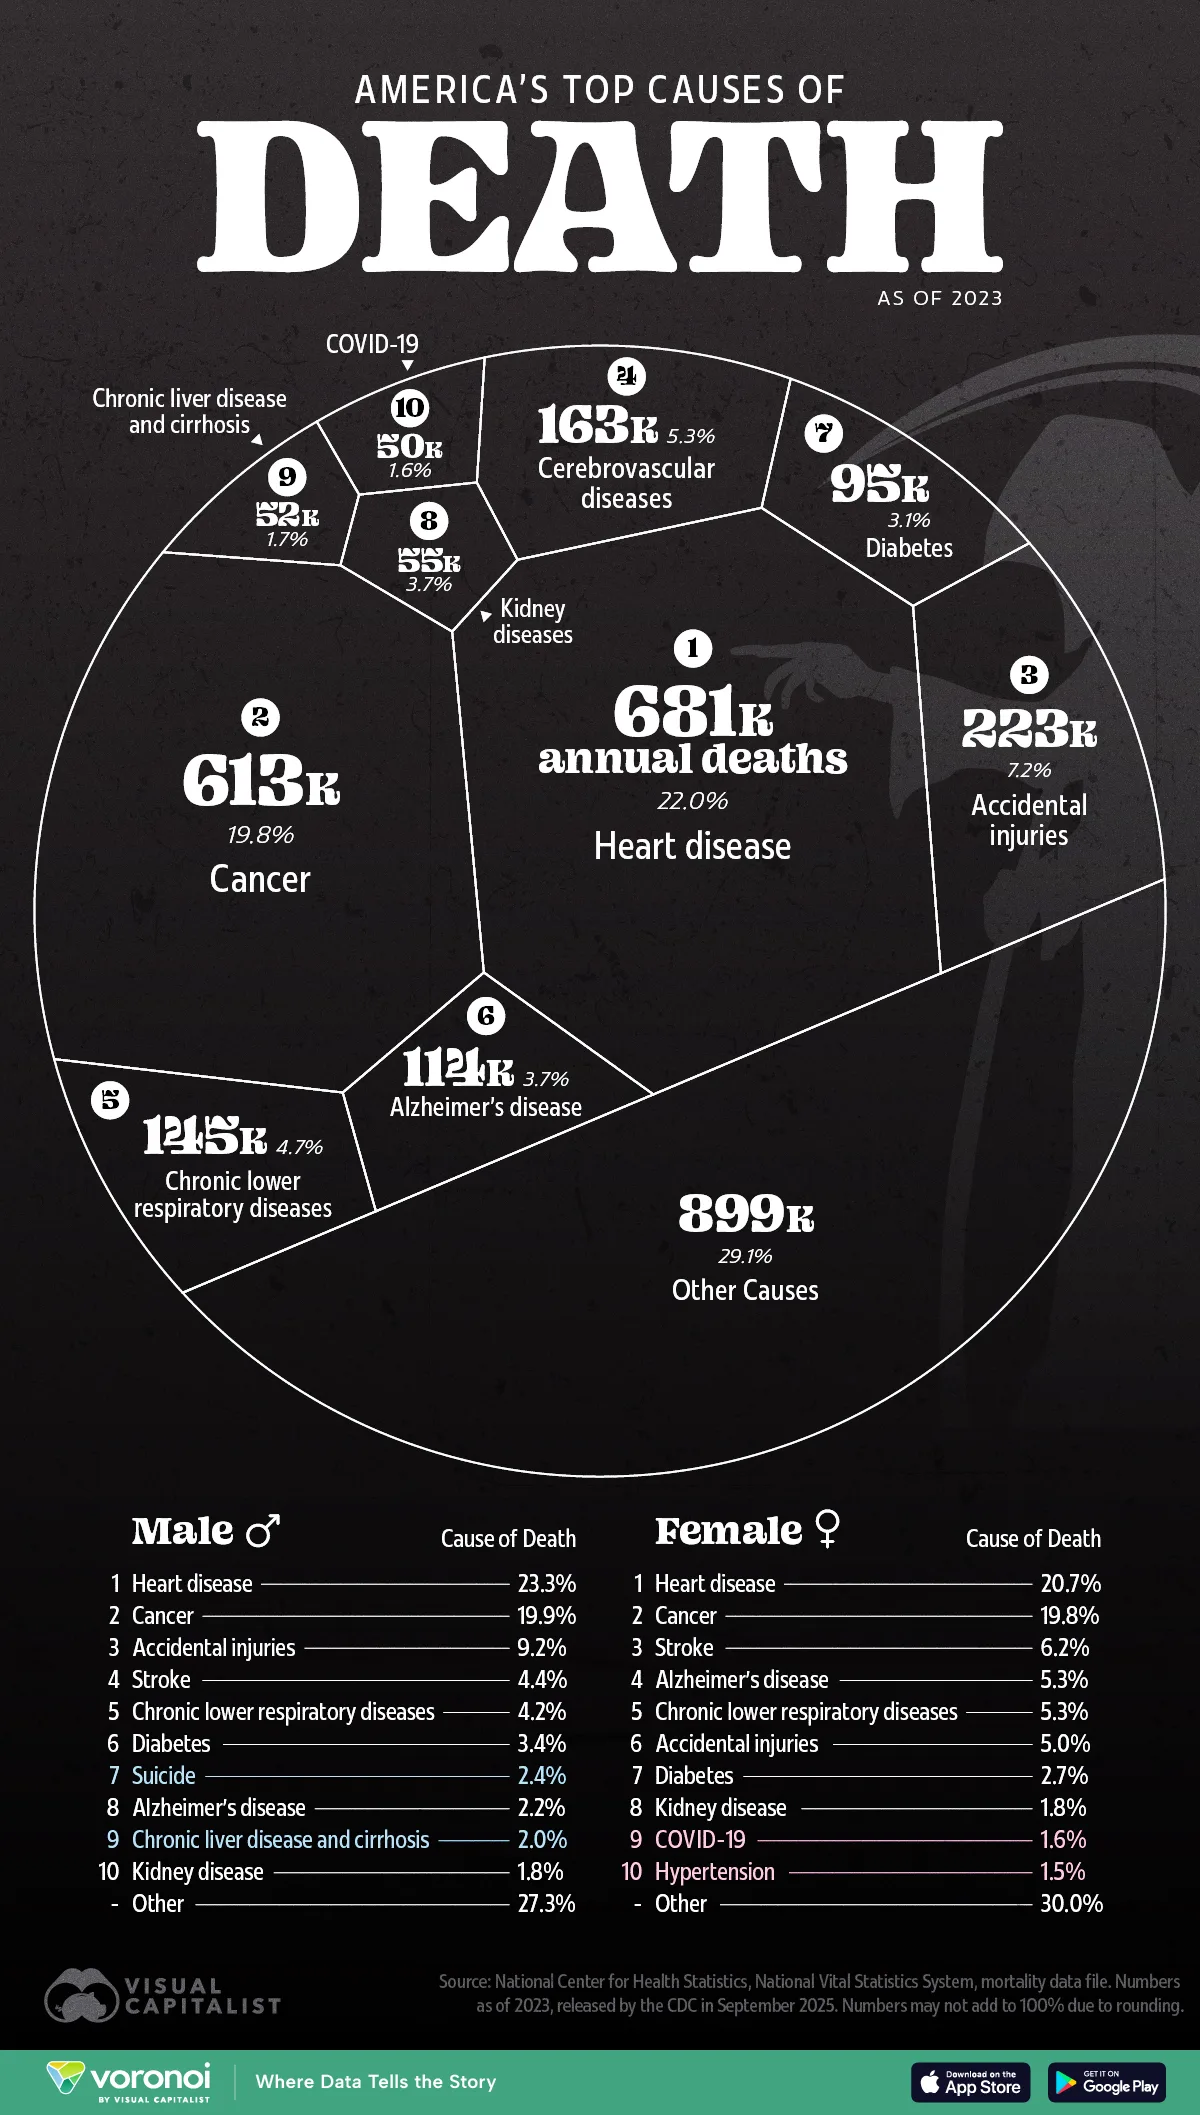
- The 10 leading causes of death account for 71% of all deaths occurring in the United States.
- Accidents are the #3 cause of death in the U.S. (222,698 deaths, 7.2%).
- Unintentional injuries rank #3 for men (9.2% of deaths), but only #6 for women (5.0%).
This infographic shows the leading causes of death in the U.S., based on recent data from the Centers for Disease Control and Prevention (CDC).
Heart Disease and Cancer Dominate
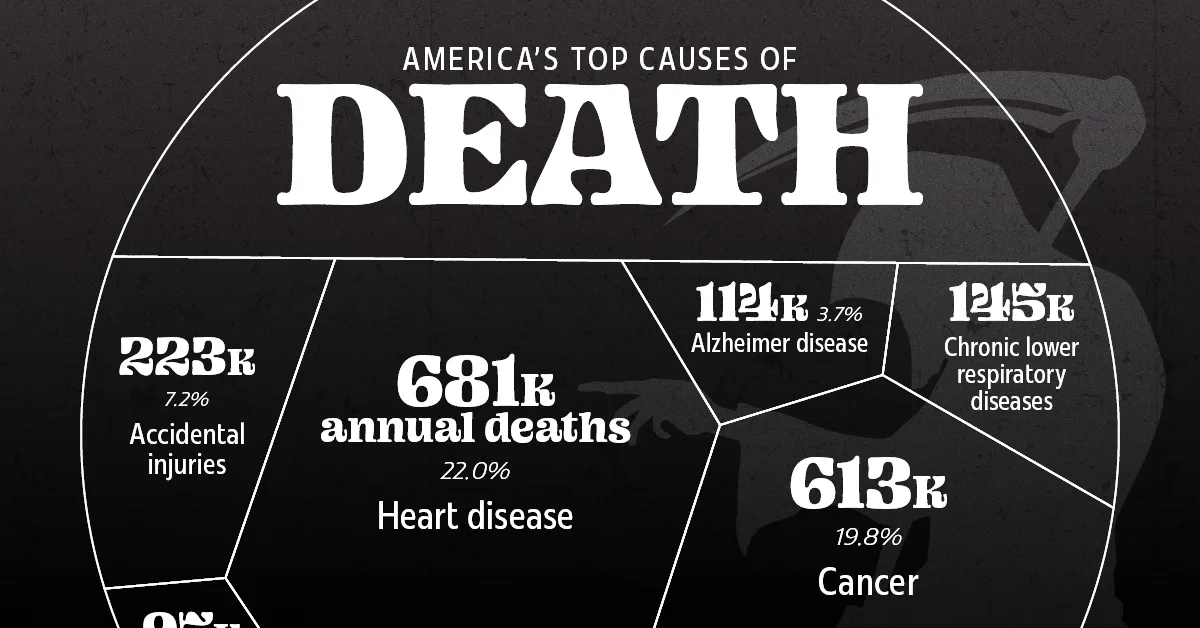
Heart disease was responsible for 680,981 deaths (22% of the total), making it the leading cause of death. Cancer followed closely with 613,352 deaths (nearly 20%).
Accidents Rank Third
Unintentional injuries, often tied to traffic accidents, falls, or overdoses, caused 222,698 deaths. This makes them the third-leading cause of death overall, and a major outlier compared to other chronic or age-related conditions. Notably, accidents impact men more heavily, ranking third for them, while they fall to sixth among women.
| Rank | Cause of Death | Deaths | % of Total |
|---|---|---|---|
| 1 | Heart diseases | 680,981 | 22.0% |
| 2 | Cancer | 613,352 | 19.8% |
| 3 | Accidental injuries | 222,698 | 7.2% |
| 4 | Cerebrovascular diseases | 162,639 | 5.3% |
| 5 | Chronic lower respiratory diseases | 145,357 | 4.7% |
| 6 | Alzheimer disease | 114,034 | 3.7% |
| 7 | Diabetes | 95,190 | 3.1% |
| 8 | Kidney diseases | 55,253 | 1.8% |
| 9 | Chronic liver disease and cirrhosis | 52,222 | 1.7% |
| 10 | COVID-19 | 49,932 | 1.6% |
| - | Other Causes | 899,306 | 29.1% |
| - | All causes (total) | 3,090,964 | 100.0% |
Aging-Related Diseases on the Rise
Alzheimer’s disease ranked sixth with 114,034 deaths, reflecting the country’s aging population. Meanwhile, other chronic conditions such as diabetes (95,190 deaths) and kidney disease (55,253 deaths) also remain significant. Although COVID-19 caused nearly 50,000 deaths in 2023, it now ranks tenth, far below its peak impact earlier in the pandemic.
Chronic Conditions Among Women
For women, stroke and Alzheimer’s disease rank higher than among men, reflecting longevity differences and aging-related health risks. Stroke is the third-leading cause of death for women at 6.2%, compared to fourth for men at 4.4%. Alzheimer’s also ranks higher among women (5.3%) than men (2.2%), consistent with the fact that women live longer on average.
| Rank | Female – Cause of Death | % |
|---|---|---|
| 1 | Heart disease | 20.7 |
| 2 | Cancer | 19.8 |
| 3 | Stroke | 6.2 |
| 4 | Alzheimer disease | 5.3 |
| 5 | Chronic lower respiratory diseases | 5.3 |
| 6 | Unintentional injuries | 5 |
| 7 | Diabetes | 2.7 |
| 8 | Kidney disease | 1.8 |
| 9 | COVID-19 | 1.6 |
| 10 | Hypertension | 1.5 |
| — | Other | 30 |
Mental Health and Other Conditions
Suicide appears in the top 10 for men, making up 2.4% of all male deaths, but it does not appear on the female list. Conversely, hypertension ranks tenth among women (1.5%), while it does not appear in the male rankings.
| Rank | Male – Cause of Death | % |
|---|---|---|
| 1 | Heart disease | 23.3 |
| 2 | Cancer | 19.9 |
| 3 | Unintentional injuries | 9.2 |
| 4 | Stroke | 4.4 |
| 5 | Chronic lower respiratory diseases | 4.2 |
| 6 | Diabetes | 3.4 |
| 7 | Suicide | 2.4 |
| 8 | Alzheimer disease | 2.2 |
| 9 | Chronic liver disease and cirrhosis | 2 |
| 10 | Kidney disease | 1.8 |
| — | Other | 27.3 |
Learn More on the Voronoi App 

If you enjoyed today’s post, check out The U.S. States Leading in Organ Donations on Voronoi, the new app from Visual Capitalist.
Europe’s Top Causes of Death, Ranked—Cancer Is #2
Heart diseases top Europe’s causes of death, followed by cancer. Explore Eurostat data behind 5.5 million EU deaths in 2022.


Europe’s Top Causes of Death, Ranked—Cancer Is #2
This was originally posted on our Voronoi app. Download the app for free on iOS or Android and discover incredible data-driven charts from a variety of trusted sources.
Key Takeaways
- Circulatory diseases—such as heart attacks and strokes—are top causes of death in the EU, claiming 1.7 million lives, or 33% of all deaths, in 2022.
- Cancer was the second most common cause, at 1.2 million (23% of deaths in 2022).
- Coronary heart disease (which causes heart attacks) and lung cancer (the most common form of cancer) are two of the most preventable causes of death in the EU.
More than 5 million people died in the EU in 2022.
The infographic breaks down top causes of death that year, revealing the persistent dominance of heart-related illnesses and the continued threat from cancer.
Data for this visualization comes from Eurostat.
While the data is somewhat dated, it was only released in March, 2025, and points to ongoing trends in mortality patterns.
Cardiovascular Diseases Still Top the List
Diseases of the circulatory system (think heart diseases and strokes) accounted for nearly 1.7 million deaths in 2022.
This was more than the combined total of the next two categories.
| Rank | Main Cause of Death | Examples | Deaths (2022) | Readable Label |
|---|---|---|---|---|
| 1 | Circulatory diseases | Heart attacks, strokes | 1,684,886 | 1.7M |
| 2 | Cancer | Lung cancer, colorectal cancer | 1,151,039 | 1.2M |
| 3 | Respiratory diseases | Eg: Pneumonia, Bronchitis | 363,461 | 364K |
| 4 | COVID-19 | N/A | 311,600 | 312K |
| 5 | External causes | Eg: Accidents, homicides | 242,363 | 242K |
| 6 | Digestive system diseases | Eg: Liver cirrhosis, Hepatitis | 216,927 | 217K |
| 7 | Nervous system diseases | Eg: Alzheimer's disease, Parkinson's disease | 212,413 | 212K |
| 8 | Mental & behavioural disorders | Eg: Dementia, substance use disorders | 210,795 | 211K |
| 9 | Hormone, diet & metabolism disorders | Eg: Diabetes, malnutrition | 178,602 | 179K |
| N/A | Other | Includes diseases not listed as the main cause, as well as unknown & unspecified causes | 583,959 | 584K |
| N/A | EU | N/A | 5,156,145 | 5.5M |
Note: Per the World Health Organization (WHO), a main cause of death is “the disease or injury which initiated the train of morbid events leading directly to death, or the circumstances of the accident or violence which produced the fatal injury.” Data derived from the medical certificate of death, which is obligatory in the Member States. The information recorded in the death certificate is according to the rules specified by the WHO.
Cardiovascular mortality correlates strongly with age: people over 65 represent about 9 in 10 of these deaths.
For reference, 85% of all deaths in this year (4.4 million) occurred among people aged over the age of 65.
Central and Eastern European countries, where smoking and hypertension rates remain high, record the highest death rates per 100,000 residents.
Cancer’s Persistent—and Growing—Burden
Cancer caused 1.15 million EU deaths in 2022, or just under one-quarter of the total.
Lung cancer leads the pack for men, while breast cancer is the deadliest for women.
When looking at totals however, lung and colorectal cancers accounted for one-third of all cancer deaths in the EU.
Unlike circulatory diseases, cancer mortality trends vary sharply by tumor type.
For example, deaths from stomach cancer have fallen around the world, yet pancreatic cancer deaths continue to rise.
COVID-19 and Other Rising Threats
Respiratory diseases took 363,000 lives, but that figure excludes the 312,000 officially attributed to COVID-19 in 2022.
Globally, the pandemic catapulted infectious disease back into the top five causes of death for the first time in decades.
Meanwhile, deaths linked to nervous-system disorders such as Alzheimer’s (212,000) now rival those from digestive diseases (like liver cirrhosis).
As Europe’s population continues to age, dementia-related deaths are projected to surge—posing new challenges for healthcare systems.
Learn More on the Voronoi App
Looking for more European content? Check out The $19 Trillion European Union Economy on Voronoi, the new app from Visual Capitalist.
-
China3 weeks ago
Ranked: The World’s Best Countries at Math in 2026
-
Debt2 weeks ago
Ranked: Countries With the Most Government Debt Per Person
-
Maps1 week ago
Mapped: The Best Employer in Every U.S. State
-
Housing4 weeks ago
Ranked: 100 Global Cities by Quality of Life and Cost
-
Economy6 days ago
Ranked: The World’s Most and Least Taxed Countries
-
Urbanization2 weeks ago
Ranked: The World’s Strongest City Economies by 2050
-
Culture3 weeks ago
Mapped: The Legal Age to Buy Beer Around the World
-
Education2 weeks ago
Ranked: The World’s Best Countries at Science in 2026


