When using forced_response with zero initial conditions it works as expected:
#Sample Data
t=[ 0,  1,  2,  3,  4,  5,  6,  7,  8,  9, 10, 11, 12, 13, 14, 15, 16, 17,
 18, 19, 20, 21, 22, 23, 24, 25, 26, 27, 28, 29, 30, 31, 32, 33, 34, 35,
 36, 37, 38, 39, 40, 41, 42, 43, 44, 45, 46, 47, 48, 49, 50, 51, 52, 53,
 54, 55, 56, 57, 58, 59, 60]

pv=[13.45,13.45,13.57,13.64,13.43,13.63,13.5,13.63,13.5,14.11,15.13,16.04
,16.88,17.84,18.64,19.2,19.95,20.56,21.33,21.9,22.49,22.86,23.38,23.97
,24.47,24.79,25.14,25.62,26.15,26.28,26.62,26.94,27.52,27.62,28.11,28.37
,28.36,28.87,29.1,29.16,29.55,29.66,29.86,30.08,30.13,30.19,30.52,30.7
,30.82,30.99,31.13,31.2,31.29,31.31,31.5,31.5,31.61,31.82,31.79,31.84
,31.96]

cv=[ 0,  0,  0,  0,  0,  0,  0,  0,  0, 10, 10, 10, 10, 10, 10, 10, 10, 10,
 10, 10, 10, 10, 10, 10, 10, 10, 10, 10, 10, 10, 10, 10, 10, 10, 10, 10,
 10, 10, 10, 10, 10, 10, 10, 10, 10, 10, 10, 10, 10, 10, 10, 10, 10, 10,
 10, 10, 10, 10, 10, 10, 10]

import numpy as np
import matplotlib.pyplot as plt
import control

gain=2
tc=20
bias=13.5

def fo_model(gain, tc):
    num=np.array([gain])
    den=np.array([tc,1])
    H = control.tf(num,den)
    (t_ ,y) = control.forced_response(H, t, cv, X0=0)
    return y+bias

plt.plot(t, pv, 'b', label='PV')
plt.plot(t, cv, 'r', label='CV')
plt.plot(t, fo_model(gain,tc), 'g', label='FO')
plt.legend()
plt.show()
CV goes from 0-10 and produces this, which is as expected:

However it doesn't work correctly (or rather it is not what I expected) when initial conditions are not zero:
#Slightly different Sample Data
t=[ 0,  1,  2,  3,  4,  5,  6,  7,  8,  9, 10, 11, 12, 13, 14, 15, 16, 17,
 18, 19, 20, 21, 22, 23, 24, 25, 26, 27, 28, 29, 30, 31, 32, 33, 34, 35,
 36, 37, 38, 39, 40, 41, 42, 43, 44, 45, 46, 47, 48, 49, 50, 51, 52, 53,
 54, 55, 56, 57, 58, 59, 60]

pv=[33.53,33.37,33.57,33.35,33.53,33.36,33.52,33.31,33.57,33.86,34.69,35.54
,36.61,37.33,38.08,38.75,39.61,40.37,40.91,41.57,42.01,42.6,43.28,43.78
,44.16,44.58,45.03,45.48,45.9,46.07,46.69,46.92,47.16,47.6,47.92,48.01
,48.26,48.49,48.94,48.97,49.39,49.39,49.67,49.8,50.02,50.15,50.5,50.42
,50.68,50.75,51.01,51.06,51.25,51.29,51.44,51.48,51.68,51.57,51.89,51.96
,51.91]

cv=[10, 10, 10, 10, 10, 10, 10, 10, 10, 20, 20, 20, 20, 20, 20, 20, 20, 20,
 20, 20, 20, 20, 20, 20, 20, 20, 20, 20, 20, 20, 20, 20, 20, 20, 20, 20,
 20, 20, 20, 20, 20, 20, 20, 20, 20, 20, 20, 20, 20, 20, 20, 20, 20, 20,
 20, 20, 20, 20, 20, 20, 20]

import numpy as np
import matplotlib.pyplot as plt
import control

gain=2
tc=20
bias=13.5

def fo_model(gain, tc):
    num=np.array([gain])
    den=np.array([tc,1])
    H = control.tf(num,den)
    (t_ ,y) = control.forced_response(H, t, cv, X0=pv[0])
    return y+bias

plt.plot(t, pv, 'b', label='PV')
plt.plot(t, cv, 'r', label='CV')
plt.plot(t, fo_model(gain,tc), 'g', label='FO')
plt.legend()
plt.show()
CV now goes from 10-20 (same system so it should match) but it produces:
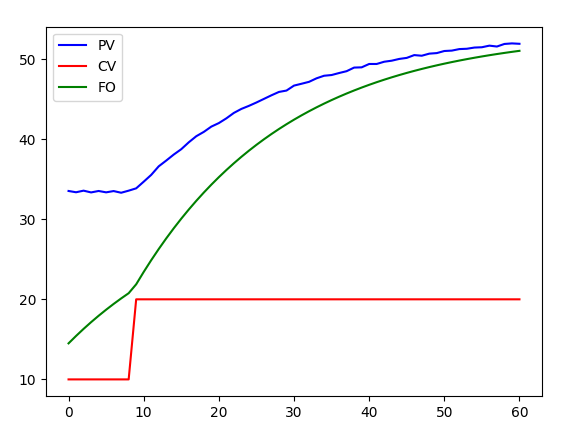
Any ideas about where I'm going wrong?
Just found this library and it's excellent, I appreciate the work!


When using forced_response with zero initial conditions it works as expected:
CV goes from 0-10 and produces this, which is as expected:

However it doesn't work correctly (or rather it is not what I expected) when initial conditions are not zero:
CV now goes from 10-20 (same system so it should match) but it produces:

Any ideas about where I'm going wrong?
Just found this library and it's excellent, I appreciate the work!