Repository navigation
How to change Root Locus plot color #789
Description
Activity
This was already asked for in #350.
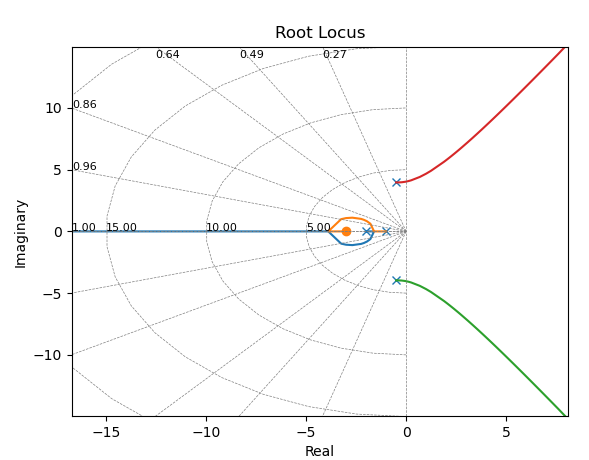
For now, you can
findobjthe lines after plotting, and then set the colours:import numpy as np import matplotlib.pyplot as plt import control as ct # bit of a hack def findlines(artist): return (isinstance(artist, plt.Line2D) and artist.get_linestyle()=='-' and isinstance(artist.get_xdata(), np.ndarray)) g = ct.tf([1],[1,1]) * ct.tf([1,3],[1,2]) * ct.tf([1],[1,1,16]) ct.rlocus(g); h = plt.gca().findobj(match=findlines) for i, h_ in enumerate(h): h_.set_color(f'C{i}') plt.show()
- locked and limited conversation to collaborators
on Nov 27, 2022


The plot color of the roots seems like similiar while using rlocus function. Instead of showing the default color, we wanted to show different color.
So, how to change the color of the desired plot which used rlocus