Description
Hello, I think this control library is powerful and in the past few months I have been using it for my studies. However when I was trying to go further I encountered with this problem.
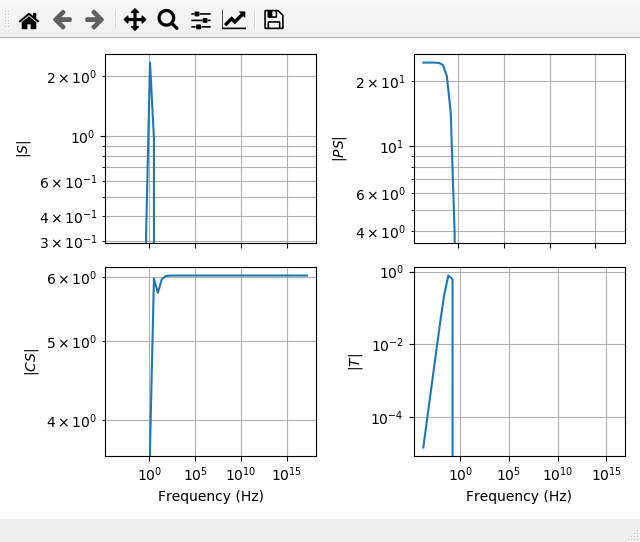
I just hoped to reproduce the result shown in VTOL Example.But I got some "RuntimeWarning: divide by zero" warnings when calling "control.matlab.gangof4" function.
Code
from __future__ import print_function

import os
import matplotlib.pyplot as plt  # MATLAB plotting functions
from control.matlab import *    # MATLAB-like functions
import numpy as np

# System parameters
m = 4
J = 0.0475
r = 0.25
g = 9.8
c = 0.05

Pi = tf([r], [J, 0, 0])  # inner loop (roll)
Po = tf([1], [m, c, 0])  # outer loop (position)

# Use state space versions
Pi = tf2ss(Pi)
Po = tf2ss(Po)


#
# This is the controller for the pitch dynamics.  Goal is to have
# fast response for the pitch dynamics so that we can use this as a
# control for the lateral dynamics
#

# Design a simple lead controller for the system
k, a, b = 200, 2, 50
Ci = k*tf([1, a], [1, b])  # lead compensator
Li = Pi*Ci

Si = feedback(1, Li)
Ti = Li*Si

Hi = parallel(feedback(Ci, Pi), -m*g*feedback(Ci*Pi, 1))

a, b, K = 0.02, 5, 2
Co = -K*tf([1, 0.3], [1, 10])  # another lead compensator
Lo = -m*g*Po*Co


# Finally compute the real outer-loop loop gain + responses
L = Co*Hi*Po
S = feedback(1, L)
T = feedback(L, 1)

plt.figure('time domain response')
y,t=step(T,T=np.linspace(0,10,100))
plt.plot(t,y)
plt.xlabel('time/s')
plt.ylabel('y(t)')
plt.grid()

plt.figure('bode graph')
bode(L, np.logspace(-4, 3))

plt.figure('nyquist')
print(L)
nyquist(L, (0.0001, 1000))
plt.axis([-4000, 300, -300000, 300000])

plt.figure('4 diags')
gangof4(Hi*Po, Co)
plt.show()
error
/home/hzy/anaconda3/envs/femcalc/lib/python3.6/site-packages/scipy/signal/filter_design.py:1622: BadCoefficients: Badly conditioned filter coefficients (numerator): the results may be meaningless
  "results may be meaningless", BadCoefficients)
/home/hzy/anaconda3/envs/femcalc/lib/python3.6/site-packages/numpy/lib/polynomial.py:736: RuntimeWarning: overflow encountered in multiply
  y = y * x + p[i]
/home/hzy/anaconda3/envs/femcalc/lib/python3.6/site-packages/control/xferfcn.py:674: RuntimeWarning: invalid value encountered in true_divide
  polyval(self.den[i][j], slist))
/home/hzy/anaconda3/envs/femcalc/lib/python3.6/site-packages/control/freqplot.py:648: RuntimeWarning: divide by zero encountered in log10
  plot_axes['t'].loglog(omega_plot, 20 * np.log10(mag) if dB else mag)
And the wrongly plotted figure is here:
Platform and Language
deepin V15.11(its underlying is like Ubuntu),Intel i5-6200U Processor
Python 3.6.7 on anaconda environment, 64 bit


Description
Hello, I think this control library is powerful and in the past few months I have been using it for my studies. However when I was trying to go further I encountered with this problem.
I just hoped to reproduce the result shown in VTOL Example.But I got some "RuntimeWarning: divide by zero" warnings when calling "control.matlab.gangof4" function.
Code
error
And the wrongly plotted figure is here:

Platform and Language
deepin V15.11(its underlying is like Ubuntu),Intel i5-6200U Processor
Python 3.6.7 on anaconda environment, 64 bit