Repository navigation
Adding cyclic point feature #82
Description

I will address the same issue as for Cartopy (SciTools/cartopy#1402). I would find extremely useful to have an automatic behavior of adding a cyclic point when needed, or at least add an option when doing a plot.
Here is an example of what I mean (data: ens_avg_snow.zip):
import xarray as xr
import proplot as plot

ens_avg_snow = xr.open_dataarray('ens_avg_snow.nc')

f, axs = plot.subplots(proj='cyl', width=8)
m = axs[0].contourf(ens_avg_snow, cmap='BuRd')
f.colorbar(m)
axs.format(
    geogridlinewidth=0.5, geogridcolor='gray8', geogridalpha=0.5, labels=True,
    coast=True, ocean=True, oceancolor='gray3', latlim=(20,90),
)
As you can see, there is a white line at 0° of longitude. I usually use the add_cyclic_point function of cartopy.utils but it is not straightforward for DataArrays because it doesn't keep the coordinates and attributes. I recently found some very useful code here: https://github.com/darothen/plot-all-in-ncfile/blob/master/plot_util.py that allows to do it easily with the function cyclic_dataarray and there is also a check_cyclic that could be used for automatically checking it.
Here is the function that allows adding a cyclic point (from the link above):
from cartopy.util import add_cyclic_point

# https://github.com/darothen/plot-all-in-ncfile/blob/master/plot_util.py
def cyclic_dataarray(da, coord='lon'):
    """ Add a cyclic coordinate point to a DataArray along a specified
    named coordinate dimension.
    """
    assert isinstance(da, xr.DataArray)

    lon_idx = da.dims.index(coord)
    cyclic_data, cyclic_coord = add_cyclic_point(da.values,
                                                 coord=da.coords[coord],
                                                 axis=lon_idx)

    # Copy and add the cyclic coordinate and data
    new_coords = dict(da.coords)
    new_coords[coord] = cyclic_coord
    new_values = cyclic_data

    new_da = xr.DataArray(new_values, dims=da.dims, coords=new_coords)

    # Copy the attributes for the re-constructed data and coords
    for att, val in da.attrs.items():
        new_da.attrs[att] = val
    for c in da.coords:
        for att in da.coords[c].attrs:
            new_da.coords[c].attrs[att] = da.coords[c].attrs[att]

    return new_da
Thus ens_avg_snow_cyclic = cyclic_dataarray(ens_avg_snow) allows to make back the previous plot without the white line. Incorporating this directly into ProPlot would be nice so that we can just add an option like for example add_cyclic=True (just need to be careful about the dimension to do the cyclic or have another way to pass it).
Activity
bradyrx commentedon Dec 4, 2019
Try passing
globe=Trueto yourcontourfcommand (https://proplot.readthedocs.io/en/latest/projection.html#Plotting-geophysical-data).lukelbd commentedon Dec 4, 2019
Yep
globe=Trueis the way to do this.This is implemented by the
standardize_2dwrapper. When #45 is implemented this will be documented on the individualProjAxes.contourf,ProjAxes.pcolor, etc. methods.mickaellalande commentedon Dec 5, 2019
I didn't see this option, great thank you!
SJOcean commentedon Dec 6, 2020
this is not working...
bradyrx commentedon Dec 6, 2020
Hi @SJOcean! Do you mind sharing a small, reproducible example where this errors? That will help guide a bug fix.
SJOcean commentedon Dec 7, 2020
Here is my case:
The dataset diff is a (180,360) numpy array.
`
import cartopy
import cartopy.crs as ccrs
import cmocean as cm
from cartopy.util import add_cyclic_point
loni = np.arange(360)
lati = np.arange(-90,90,1)
diff = np.subtract(sit_414_jan_int , sit_360_jan_int)
fig =plt.figure(figsize=(15,10))
cmap=cm.cm.ice
ax = plt.axes(projection=ccrs.PlateCarree())
ax.set_extent([-180,180,-90,90])
diff_new,lon_new = add_cyclic_point(diff, coord=loni)
m =plt.contourf(lon_new, lati, diff_new, transform= ccrs.PlateCarree(),cmap = cmap, globe=True)
ax.coastlines(color = '0.5', linewidth = 3.0)
ax.gridlines(draw_labels=False)
gl = ax.gridlines(draw_labels=True,xlocs=np.arange(-180, 181, 40), ylocs=np.arange(-90, 91, 30)) #xlocs=np.arange(-180, 181, 40)
gl.rotate_labels = False
gl.top_labels = False
gl.bottom_labels = False
cbar= plt.colorbar(m,orientation='horizontal',shrink=0.7)
cbar.ax.tick_params(labelsize=s)
cbar.set_label('Sea-ice thickness (m)', fontsize = 35)
plt.show()
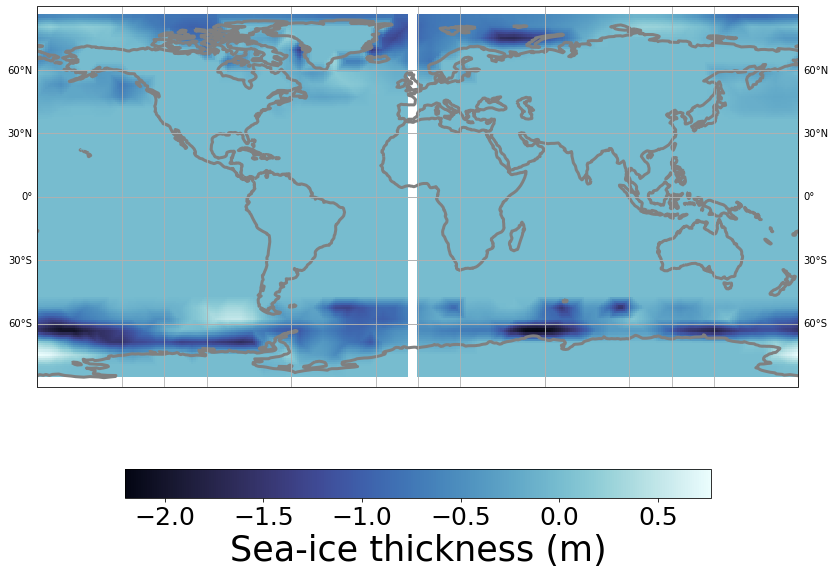
`
SJOcean commentedon Dec 7, 2020
I did put the globe=True in and the result was the same. It plots with a message saying that there is no argument 'globe'.
mickaellalande commentedon Dec 7, 2020
Seems like you are using directly matplotlib and cartopy. The
globe=Trueis specific to Proplot (if I'm not wrong), so you should use directly the Proplot syntax (that is simplified from raw matplotlib/cartopy code). Here is an example, without formatting that you can adjust as you want later:PS: you don't need to add a cyclic point with this syntax, it is automatically done by Proplot.
I hope this can help you!
SJOcean commentedon Dec 7, 2020
Thank you but unfortunately there is still the white line...
SJOcean commentedon Dec 7, 2020
I changed back to the original codes, it seems that the problem is caused by this line:
ax = plt.axes(projection=ccrs.PlateCarree())
There would be no white line if I don't put projection on, hopefully this problem can be solved somehow...
mickaellalande commentedon Dec 7, 2020
Can you provide your data and version of proplot (
plot.__version__)? Because it works fine for me for any data I used so far, with the version0.6.4of proplot.SJOcean commentedon Dec 7, 2020
It is the same version, 0.6.4
lukelbd commentedon Jun 28, 2021
Hi @SJOcean (a million years later), it looks like you are using pyplot rather than proplot. The
globe=Truefeature that fixes gaps in cyclic data is added by proplot to the native matplotlig+cartopy plotting commands. So, I am closing this issue, but please see this page for more info.