Repository navigation
Different result, slower runtime of heatmap between 2.0.0 and 2.0.1 #8947

Description

Bug report
Bug summary
I am using Matplotlib with Basemap to create heatmaps of data.
A change introduced between version 2.0.0 and 2.0.1 caused my code to:
- Produce a different result
- Run significantly slower
The problem still seems to exist in 2.0.2.
I also ran some profiling to have a look at the differences, and the increase in time seems to be in the resample function (from 0.473s total time to 19.042s total time)
Code for reproduction
import csv
import time

import numpy as np
import matplotlib
import matplotlib.pyplot as plt
import matplotlib.cm as cm
from mpl_toolkits.basemap import Basemap


def create_basemap():
    m = Basemap(projection='cyl', llcrnrlat=-90, urcrnrlat=90,
                llcrnrlon=-180, urcrnrlon=180, resolution='c')
    m.drawmapboundary(fill_color='#b4d0d0')
    m.drawcoastlines(linewidth=0.25, color="#ffffff")
    m.fillcontinents(color="grey", lake_color='#b4d0d0')

    m.drawparallels(np.arange(-90., 91., 30.), linewidth="0.25", color="#333333")
    m.drawmeridians(np.arange(-180., 181., 60.), linewidth="0.25", color="#555555")
    return m


def create_heatmap(positions):
    heatmap = np.zeros((180, 360))
    extents = [[-90, 90], [-180, 180]]

    lats, lons = map(list, zip(*positions))

    subheatmap, xedges, yedges = np.histogram2d(lats, lons, bins=[180, 360], range=extents)
    extent = [xedges[0], xedges[-1], yedges[0], yedges[-1]]
    heatmap = np.add(heatmap, subheatmap)

    fig = plt.figure()
    m = create_basemap()

    cmap = cm.jet
    cmap.set_bad(alpha=0.0)

    im = m.imshow(heatmap, cmap=cmap, interpolation='bicubic', extent=extent, origin='lower', alpha=1.0, norm=matplotlib.colors.LogNorm(), vmin=1, vmax=2, zorder=100)
    cb = fig.colorbar(im, shrink=0.5, format="%d")

    plt.title("Test")
    plt.savefig("test.png", dpi=500, bbox_inches='tight', pad_inches=0.1)
    plt.close()


positions = [(50, i) for i in range(50)]
start = time.time()
create_heatmap(positions)
print "Runtime: {0}".format(time.time() - start)
Version 2.0.0 outcome
Runtime: 2.31200003624

python -m cProfile --sort=tottime script.py:
         667764 function calls (659117 primitive calls) in 3.555 seconds

   Ordered by: internal time

   ncalls  tottime  percall  cumtime  percall filename:lineno(function)
        2    0.702    0.351    0.702    0.351 {matplotlib._png.write_png}
        2    0.473    0.237    0.473    0.237 {matplotlib._image.resample}
        1    0.138    0.138    0.138    0.138 {_tkinter.create}
      890    0.117    0.000    0.117    0.000 {method 'is_valid' of '_geoslib.BaseGeometry' objects}
       15    0.106    0.007    0.632    0.042 __init__.py:1(<module>)
        1    0.090    0.090    0.135    0.135 __init__.py:14(<module>)
      296    0.083    0.000    0.083    0.000 {method 'intersection' of '_geoslib.BaseGeometry' objects}
        2    0.068    0.034    0.681    0.340 image.py:275(_make_image)
    11413    0.055    0.000    0.058    0.000 {numpy.core.multiarray.array}
      300    0.050    0.000    0.072    0.000 {method 'draw_path' of 'matplotlib.backends._backend_agg.RendererAgg' objects}
...
Version 2.0.1 outcome
Runtime: 21.0169999599

python -m cProfile --sort=tottime script.py:
         1763720 function calls (1754827 primitive calls) in 23.725 seconds

   Ordered by: internal time

   ncalls  tottime  percall  cumtime  percall filename:lineno(function)
        4   19.042    4.761   19.043    4.761 {matplotlib._image.resample}
        2    0.735    0.367    0.735    0.367 {matplotlib._png.write_png}
        2    0.609    0.304    1.377    0.688 font_manager.py:558(createFontList)
       60    0.138    0.002    0.336    0.006 afm.py:181(_parse_char_metrics)
        1    0.135    0.135    0.135    0.135 {_tkinter.create}
        2    0.133    0.067   19.309    9.655 image.py:275(_make_image)
      890    0.115    0.000    0.115    0.000 {method 'is_valid' of '_geoslib.BaseGeometry' objects}
        1    0.107    0.107    0.159    0.159 __init__.py:14(<module>)
       15    0.106    0.007    0.637    0.042 __init__.py:1(<module>)
      559    0.104    0.000    0.104    0.000 {method 'get_sfnt' of 'matplotlib.ft2font.FT2Font' objects}
Matplotlib version
- Operating System: Windows 10
- Matplotlib Version: 2.0.0/2.0.1 (from pip)
- Python Version: 2.7.13
- Jupyter Version (if applicable): N/A
- Other Libraries: basemap 1.1.0, numpy 1.13.1
Activity
afvincent commentedon Oct 17, 2017
@NickG123 Could you test if the problem is still there with Matplotlib 2.1?
On my own workstation (Fedora 26), with Python 3.6.3 and Matplotlib 2.1 (both from conda), the results are more similar to yours with Matplotlib 2.0.0 than those with Matplotlib 2.0.1:
afvincent commentedon Oct 17, 2017
I did not perform a proper
git bisectbut this might have been fixed by @tacaswell in #8966 (more precisely 12c27f3)NickG123 commentedon Oct 18, 2017
@afvincent Thanks for having a look.
I do see a significant improvement in performance with Matplotlib 2.1, back down to roughly the same speed as 2.0.0.
However, the resulting image is very strage:
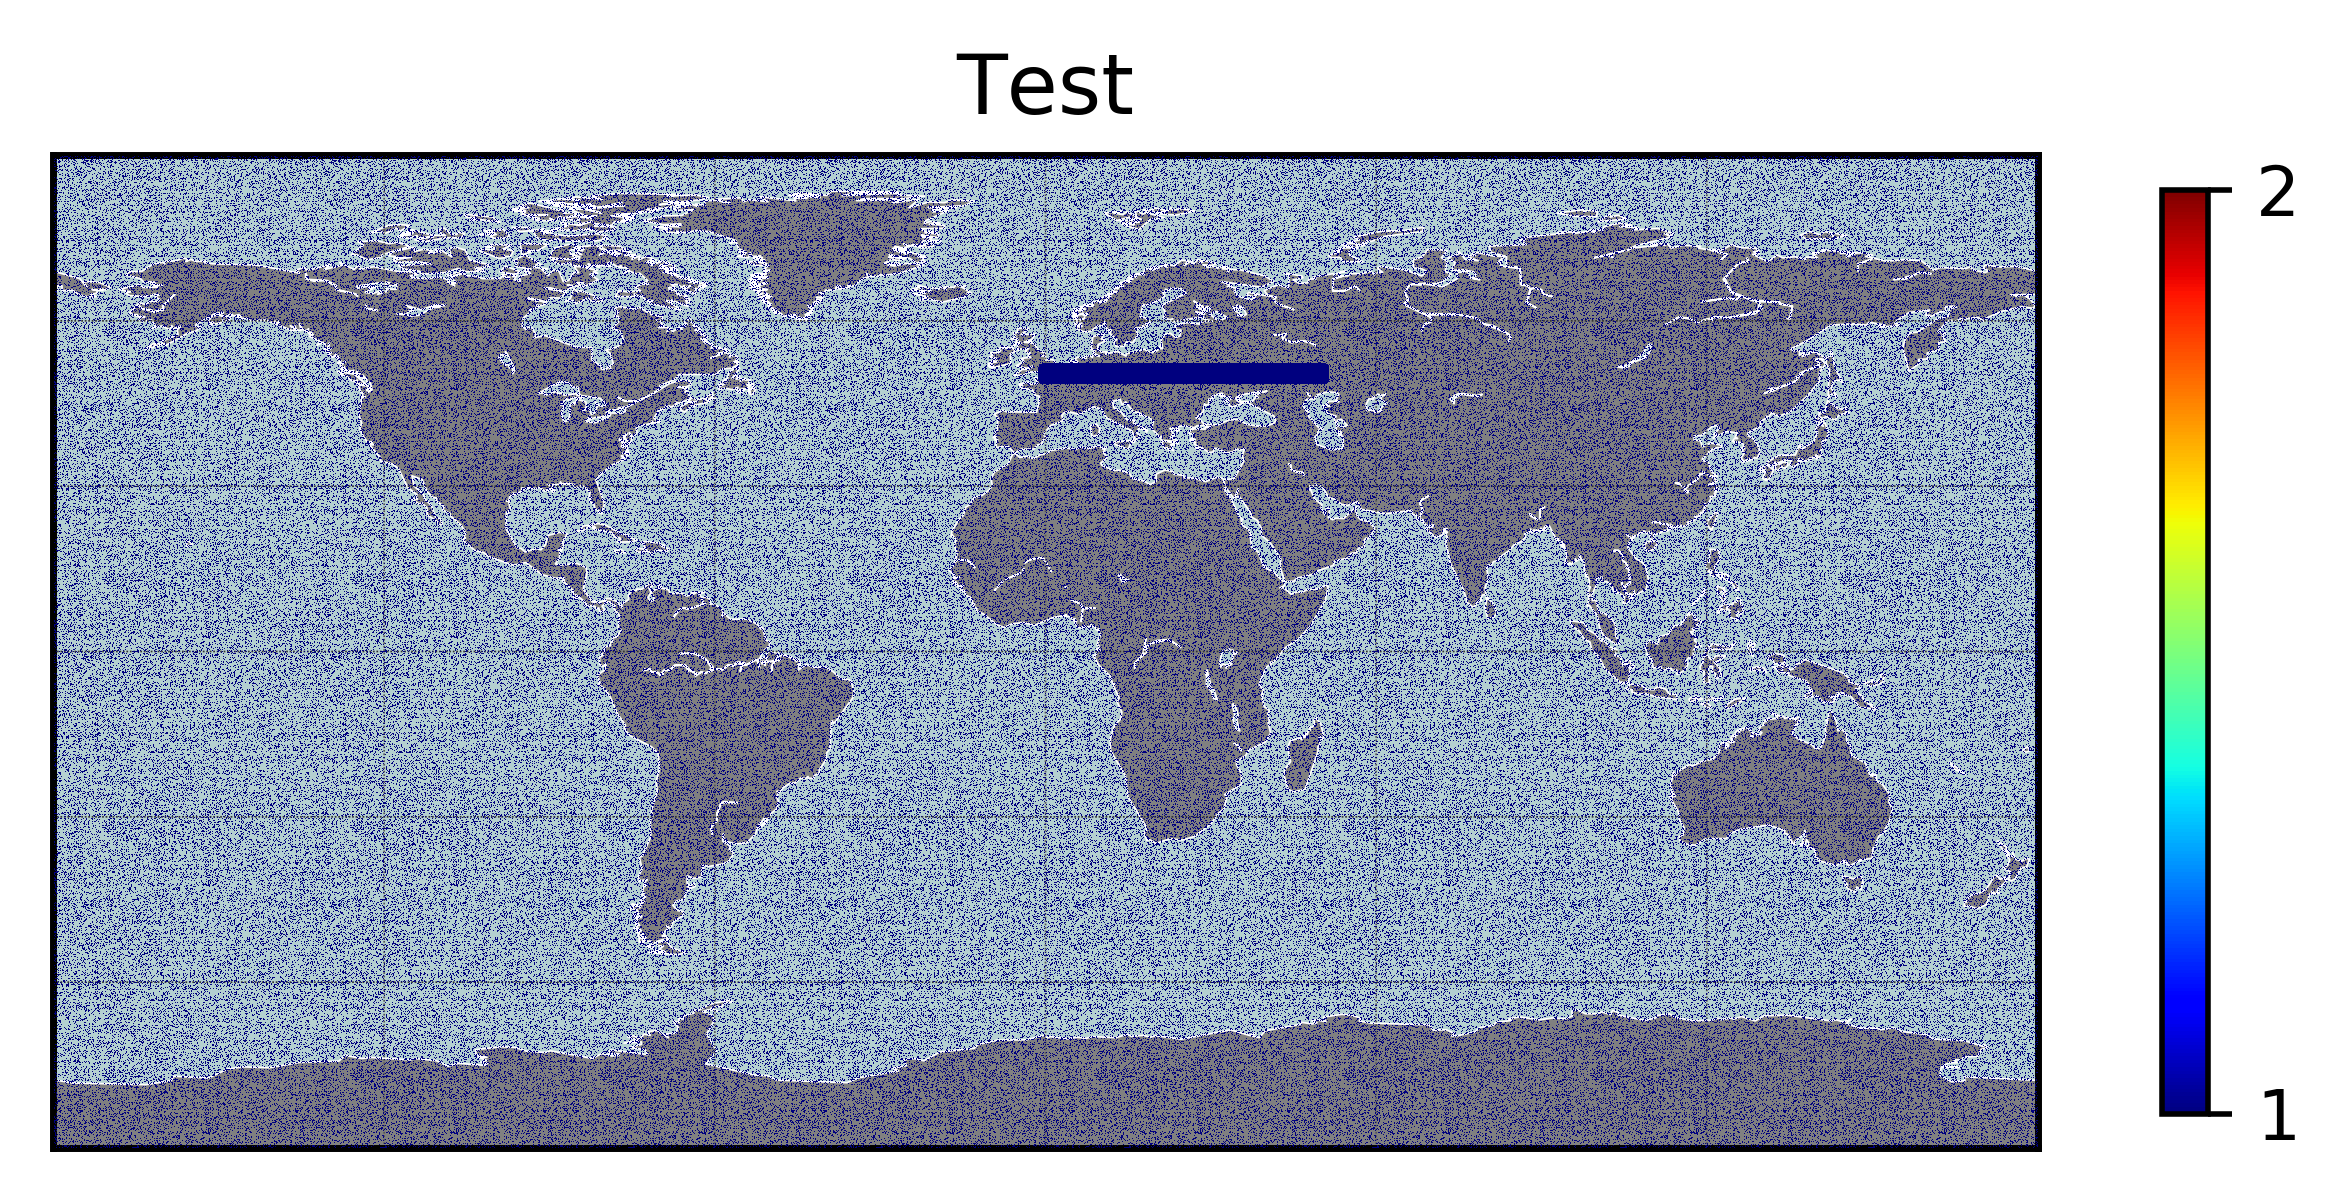
I do get a couple of warnings that might be related, but they are coming out of the Basemap library, not my code:
WeatherGod commentedon Oct 18, 2017
WeatherGod commentedon Oct 18, 2017
tacaswell commentedon Oct 18, 2017
The fuzz over the oceans is almost certainly the same as the fuzz we saw at the edges of #8966 Trying with a lower-order interpolation might help.
NickG123 commentedon Oct 18, 2017
Looks like that's the problem
Both
interpolation='none'andinterpolation='nearest'generate the expected image (the same one as version 2.0.0), while all other options produce varying degrees of "fuzz" across the whole map.Thanks,
Nick
tacaswell commentedon Aug 11, 2018
@NickG123 can you reproduce this with 2.2.3?
NickG123 commentedon Aug 13, 2018
Hi @tacaswell, It looks like v2.2.3 still produces the same result as with 2.1 above.
However, my use case is satisfied by using a lower order interpolation, so I guess it is up to you how much of a priority this is.
Thanks,
Nick
jklymak commentedon Feb 12, 2019
I think we solved the original problem, so I'm closing, but feel free to re-open...