Repository navigation
Wishlist: Multidimensional colormaps #4369
Description

xref #3343
TL;DR: It would be nice if it were possible to have color maps for multidimensional data, instead of expecting the color to depend only on a single quantity as is currently the case.
I'm currently working on an application that would like to be able to modulate the color and opacity of an image independently (as in Figure 3.B.b of Allen et al. 2012) so that color indicates a parameter estimate and opacity indicates a statistic assessing the reliability of that estimate:

Currently, this must be accomplished by applying a color map to the parameter estimate, then overwriting the alpha channel with the statistical map, and finally calling imshow with the computed RGBA data. (This is what @mwaskom is doing in the referenced issue.) This is a nuisance, and more importantly, it forces all interpolation to be done in RGBA space instead of in data space (xref #5490).
Rather than simply making it possible to control alpha independently of RGB, it would make sense to allow color maps that map multidimensional data to RGBA space. Then imshow's color map for 3-dimensional input can default to id ⊕ 1, and for 4-dimensional input to id, which gets rid of those special cases and makes it possible to have other color maps of those dimensionalities.
One could imagine other use cases for this in neuroimaging; for instance, diffusion tensor images are commonly displayed with hue depending on the principal eigenvector of a symmetric tensor field, while luminosity depends on the dispersion of the eigenvalues.

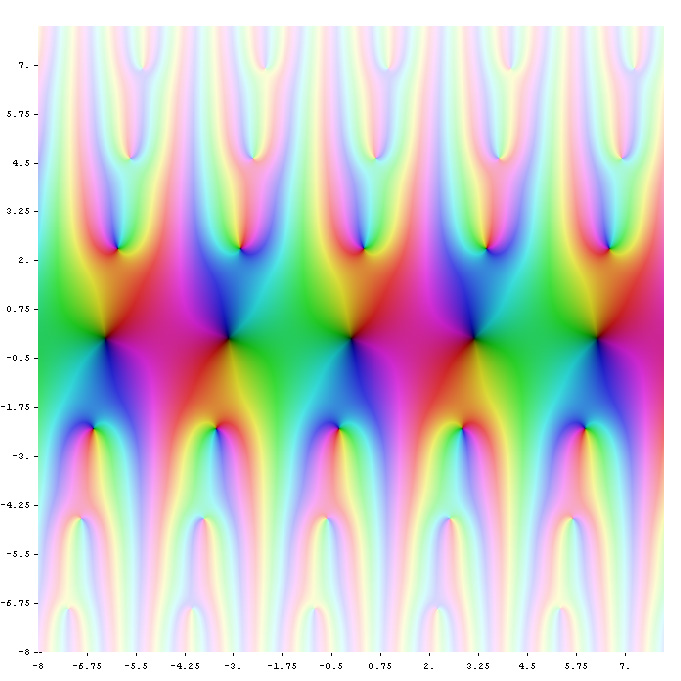
In a completely different direction, one could display a complex-valued function by splitting the complex data into real and imaginary parts, and then applying a two-dimensional color map that sets hue based on the argument and luminosity based on the modulus of the input:
Activity
tacaswell commentedon Apr 22, 2015
All sounds great to me. I see no technical issue, it is just a matter of someone doing this.
If we only want to map 2D data -> rgba than I think a family of normalizers which go from data -> unit-disk (or is unit square more sensible) in the complex plane and then color maps that go from the unit disk -> RGBA would be a good start.
If we want to do higher dimensions map to quaternions (or maybe that is getting too fancy?).
OceanWolf commentedon Apr 23, 2015
I guess though we shouldn't limit ourselves to 2d colour spaces.
Thinking of colour spaces, have you heard of the L_a_b* colour space? http://en.wikipedia.org/wiki/Lab_color_space as it "aspires to perceptual uniformity" I wonder if this could help influence our choice of colourmaps for our colour revolution...
OceanWolf commentedon Apr 23, 2015
Some other related issues:
If we wanted to plot multi-dimensional colormaps then I guess we need to change the colorbar implementation as well to deal with this...
tacaswell commentedon Apr 23, 2015
The 'luminescence' in this case is a synonym for monochrome (which coming from a light microscopy background means luminescence on the detector side) so the documentation is fine.
endolith commentedon Feb 20, 2016
See also discussion on Stack Overflow.
I've been doing this "by hand" in Lab space with
mpmath.cplot, which takes a function to generate the RGB color from the amplitude and phase of each pixel (but is extremely slow):Actually this is using colorspacious now, and it's cylindrical coordinates, so "Jch space"?
Edit: this is now at https://github.com/endolith/complex_colormap
sbenthall commentedon Aug 5, 2020
+1 wanting this feature.
efiring commentedon Aug 10, 2020
@njsmith, since this involves color spaces and targets neuroscience, perhaps among other applications, do you have some advice?
efiring commentedon Aug 10, 2020
The simplest version of this, via control of alpha, is being revived in #6268.
My suspicion is that perhaps anything beyond this should be handled as a separate package that pre-processes the inputs and returns RGBA image or QuadMesh arrays for display by matplotlib's existing functionality, or that invokes that functionality directly.
arshadpatel2001 commentedon Mar 4, 2023
Hey, is anyone working on this?
If not I would like to contribute towards the same And would like to know more about it, and how I can get started?
OceanWolf commentedon Mar 11, 2023
@arshadpatel2001 Have you taken a look at the repository of @endolith posted above, that sounds like a good first step. I don't know if we need to extend the concept of perceptually-uniform to 2d, i.e. if so maybe we take the | grad C | to create a perceptual scalar field?
github-actions commentedon Mar 11, 2024
This issue has been marked "inactive" because it has been 365 days since the last comment. If this issue is still present in recent Matplotlib releases, or the feature request is still wanted, please leave a comment and this label will be removed. If there are no updates in another 30 days, this issue will be automatically closed, but you are free to re-open or create a new issue if needed. We value issue reports, and this procedure is meant to help us resurface and prioritize issues that have not been addressed yet, not make them disappear. Thanks for your help!
story645 commentedon Dec 13, 2024
This is essentially being worked on as part of the colormapping work started in #28658
timhoffm commentedon Dec 13, 2024
Tracked in #14168, and worked on in #28658, #28454, #29221.