Repository navigation
[Bug]: ValueError: The 'color' keyword argument must have one color per dataset #30857
Description

Bug summary
We can plot multiple lines in one color with plt.plot, but not with plt.hist.
I'm not sure if this considered as a bug, but I can't understand why hist force this requirement.
Code for reproduction
import matplotlib.pyplot as plt

data = [[0, 1, 2], [3, 4, 5]]

plt.plot(data, color='k')
plt.show()

plt.hist(data, color='k')
Actual outcome
plt.plot works as expected, but plt.hist get the following error
ValueError: The 'color' keyword argument must have one color per dataset, but 2 datasets and 1 colors were provided.
Expected outcome
Just plot the histograms in same color
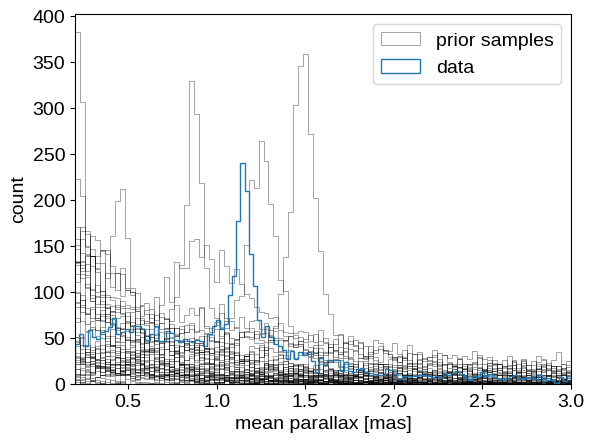
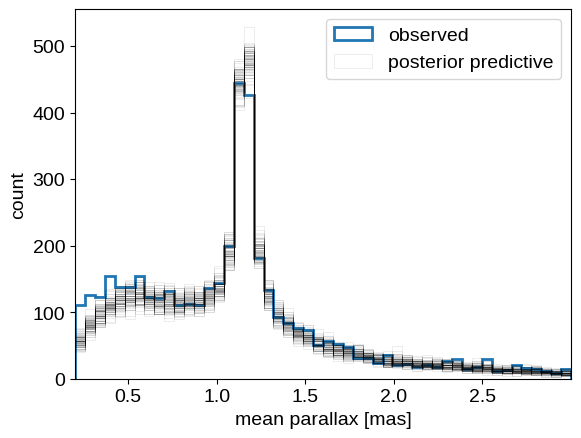
What I want to achieve is
Additional information
No response
Operating system
No response
Matplotlib Version
3.10.8
Matplotlib Backend
No response
Python version
No response
Jupyter version
No response
Installation
None
Activity
jkeo180 commentedon Dec 15, 2025
do you mind if i fork the code and see about fixing the problem?
gapplef commentedon Dec 15, 2025
@jkeo180 Sorry, but what do you mean by 'fork the code'? I provided the minimal reproducible example above.
jkeo180 commentedon Dec 15, 2025
i'm sorry i should've been more clear. Did you want help fixing a bug?
gapplef commentedon Dec 15, 2025
Yeah, if this is not the intended behavior, I may have a look.
story645 commentedon Dec 15, 2025
@rcomer, does this get fixed w/ #30808?
rcomer commentedon Dec 15, 2025
No, I deliberately didn't handle color(s) in #30808
I actually hadn't noticed there that the keyword for
histis the singular color.FWIW I think it's entirely reasonable to want to pass a single color here. For the "step" type in the given images you can already work around it by passing
edgecolor='k', but you might not think of that unless you've realised that these are a bunch of unfilled polygons rather than a bunch of lines. I suspect most scientists busy plotting data do not have their head in the "what sort of artist is this" space.The restriction to one color per dataset goes back a long way (I reproduced with v3.0). So I guess this sort of use case just wasn't anticipated.
timhoffm commentedon Dec 15, 2025
I agree that accepting a single value would be reasonable (though likely rarely as in many cases, you'll want to be able to distinguish the datasets.
The trivial workaround for now is
color=["k"] * len(data)story645 commentedon Dec 15, 2025
Sorry for not reading through before asking :/
@gapplef it's not a bug but an artifact? I also think we should support the single color argument. Would you be interested in making a pull request to support it?
rcomer commentedon Dec 15, 2025
No need to apologise - I think it’s entirely reasonable and more efficient to ask someone who already has it in their head.
gapplef commentedon Dec 16, 2025
@story645 I have made a PR to support single color for multiple dataset in
hist.I made only a minimal change, as I am not familiar with the code base.
Also,
histsupports a simple list of colors as input for multiple dataset, butplotdoes not support this. Is this inconsistency considered a problem?timhoffm commentedon Dec 16, 2025
No. We typically only have multiple datasets (and with that lists of colors) if there's a dependency between the data (e.g. stacked hist). We don't want to make every plotting method vectorized as that increases complexity and overhead.
plotsupports multiple datasets for historic reasons, but we don't go down this road further.gapplef commentedon Dec 17, 2025
Got it, thanks.