Repository navigation
Fill area between scatter plots. #99
Description

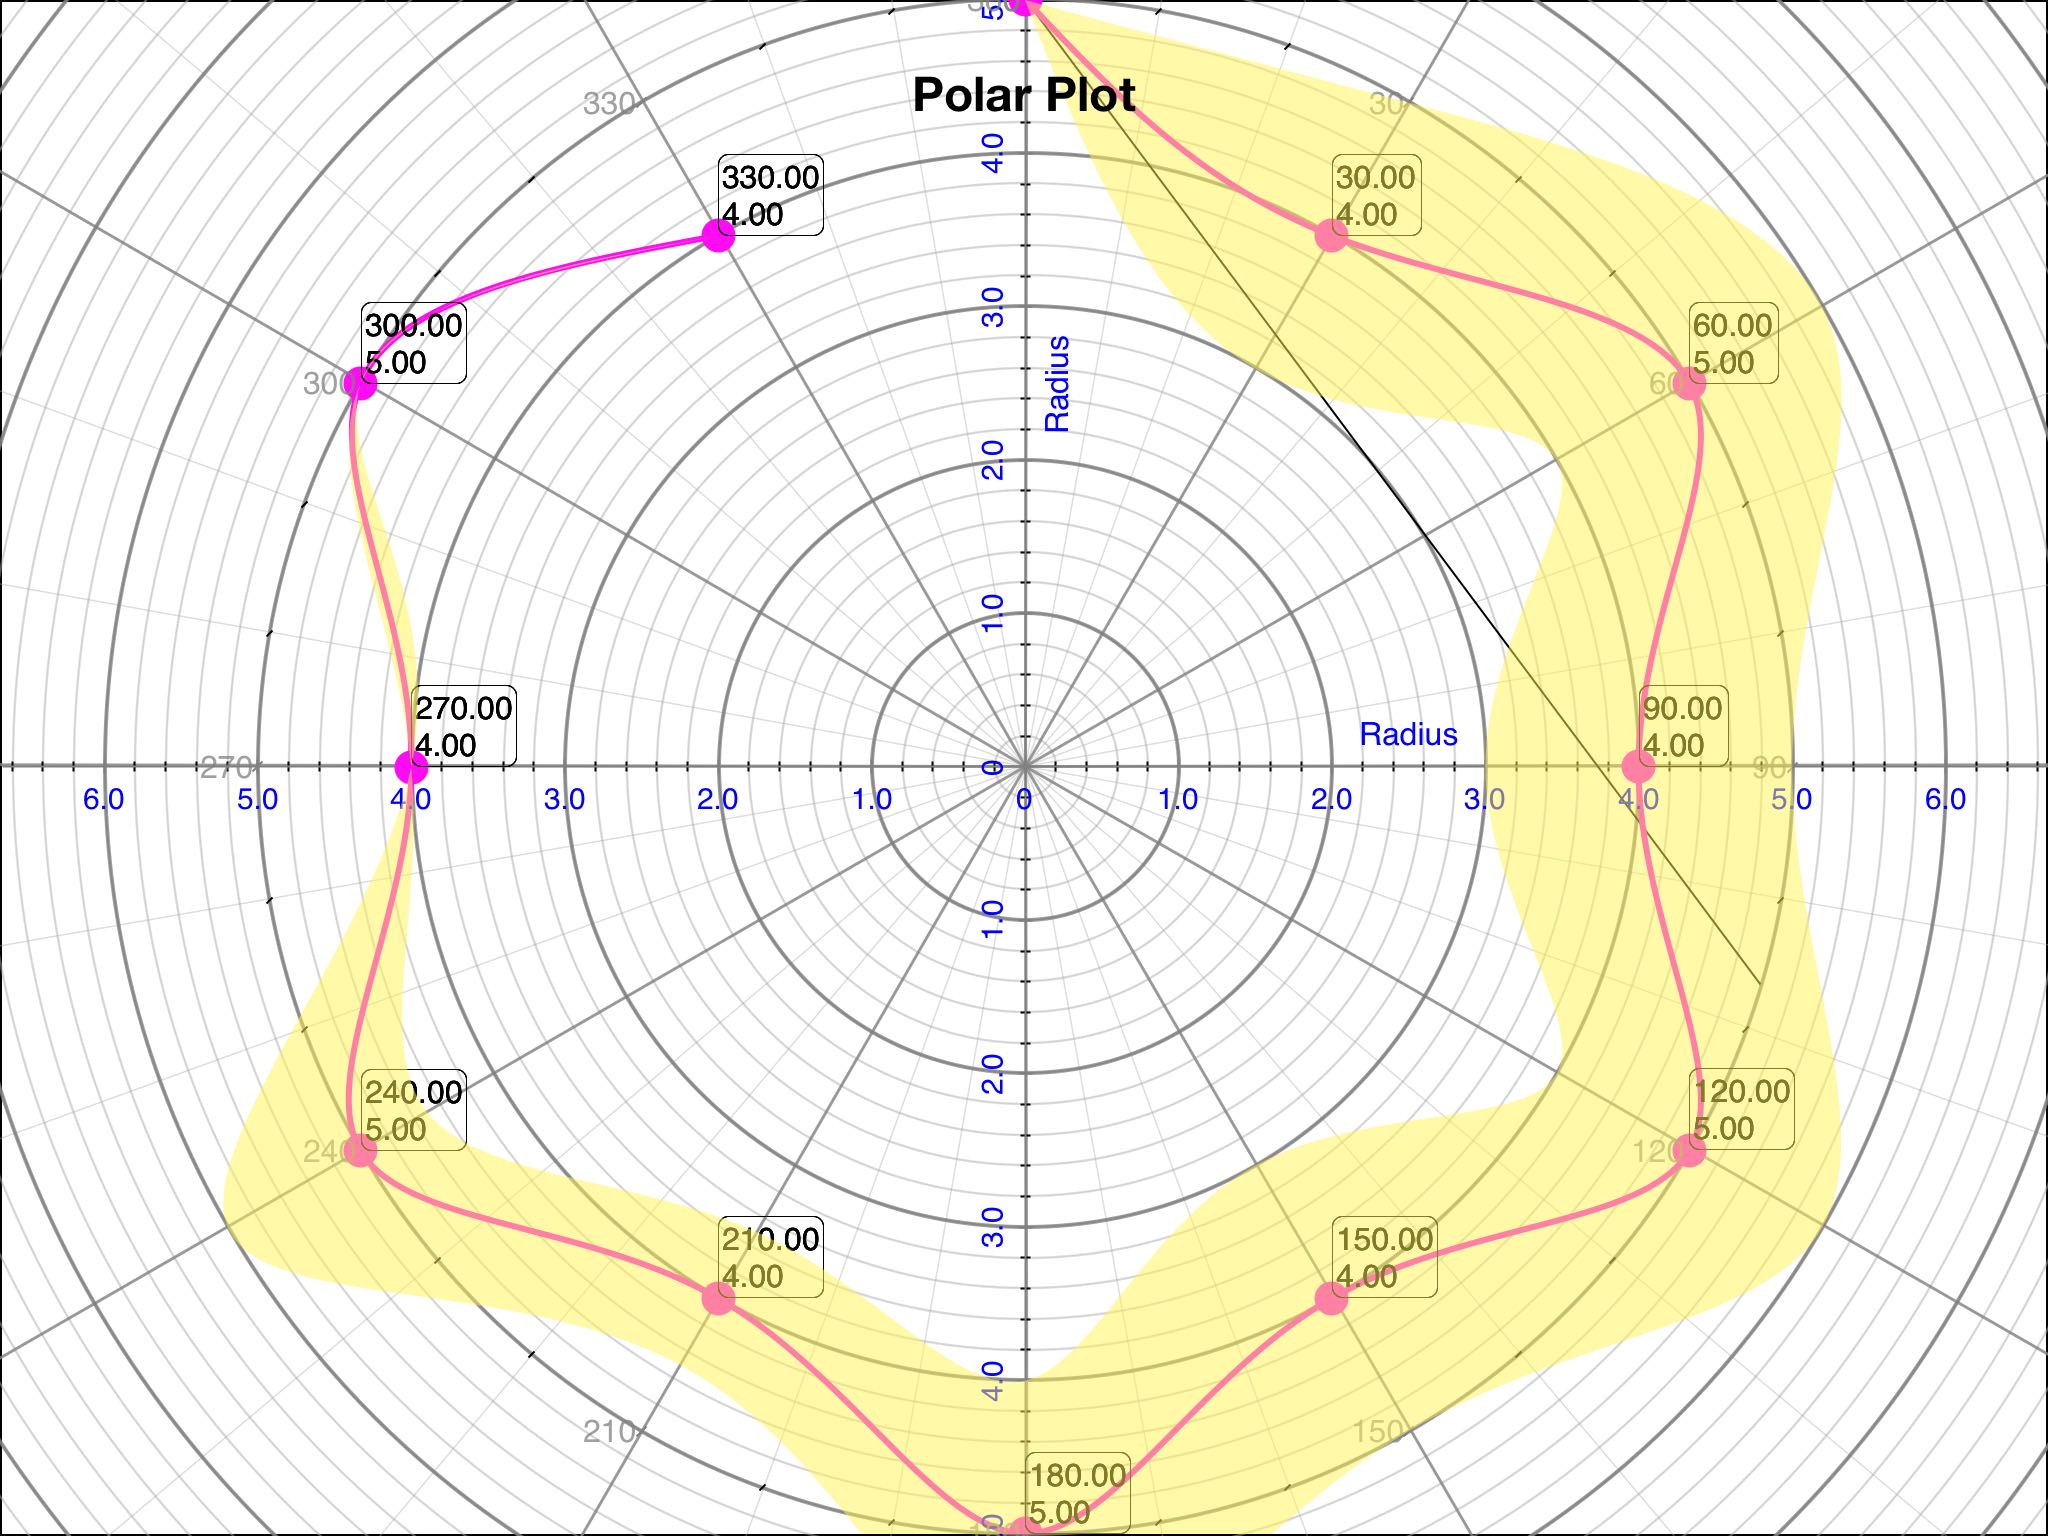
I need to make graphic similar to that one on image on iOS. I had 3 ideas - build scatterplots and fill area between them - it's impossible, build one scatterplot that is 'closed figure' and fill it - it's impossible, build rangeplots - all is ok, i can fill them, but they have no interpolation. Maybe there is another opportunity to do it, please help. Thx

Activity
[-]Fill area between scater plots.[/-][+]Fill area between scatter plots.[/+]eskroch commentedon Aug 5, 2014
Possible duplicate of issue #13.
swainwri commentedon Nov 13, 2020
I required error bands on either side of a scatterplot. My solution was to create a CPTPlotSpaceAnnotation, using 2 clear coloured scatterplots which follow the outside of these bands,ie data relative to the actual scatterplot. From the newDataLinePath of the 2 Scatterplots, one can generate an image to include in a CPTPlotSpaceAnnotation. One uses CPTPlotDelegate: func didFinishDrawing(_ plot: CPTPlot) {} and collects the updated CGPaths through a couple of cycles before being able to create this image the size of graph.bounds, add/remove annotation to plotArea.