Repository navigation
Support heat maps #33
Description

Moved from Google Code issue #559.
Add support for heatmaps. These graphs add another dimension by allowing coloring an area depending on a value. Colors could be specified either as a range or as a color ramp with a limited number where each color defines an area of input values.
Layout is a bit challenging because sometimes you want the colored areas to form a figure (like a block of n x m cells) and sometimes they can be like plot symbols in a scatter plot.
Activity
swainwri commentedon Feb 3, 2021
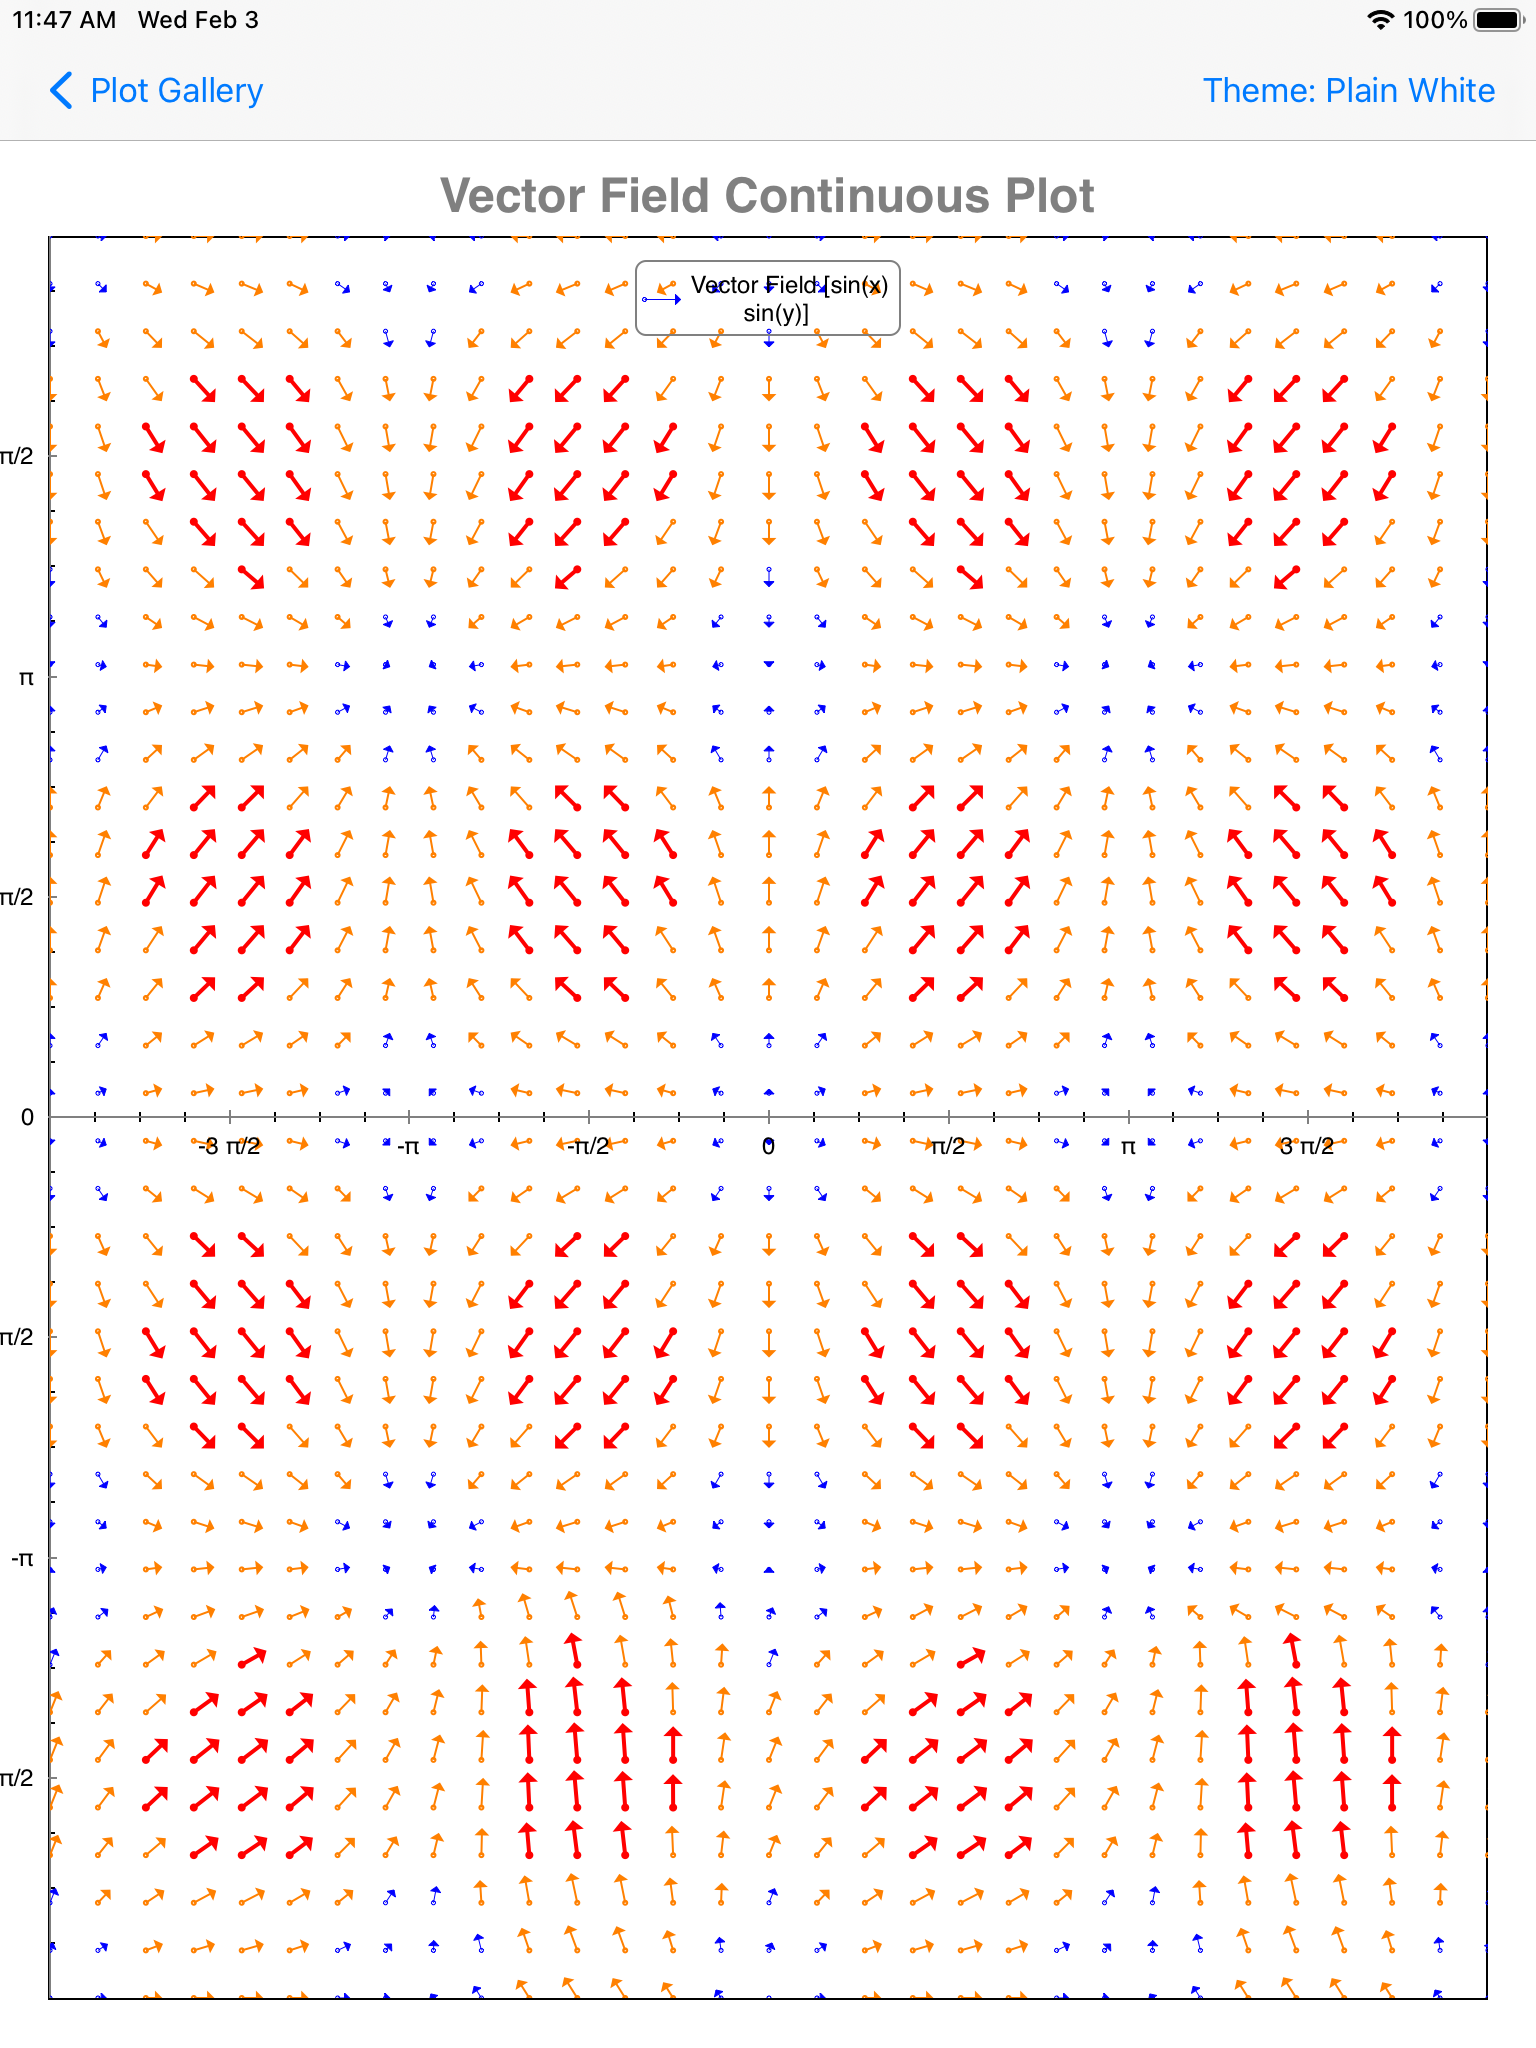
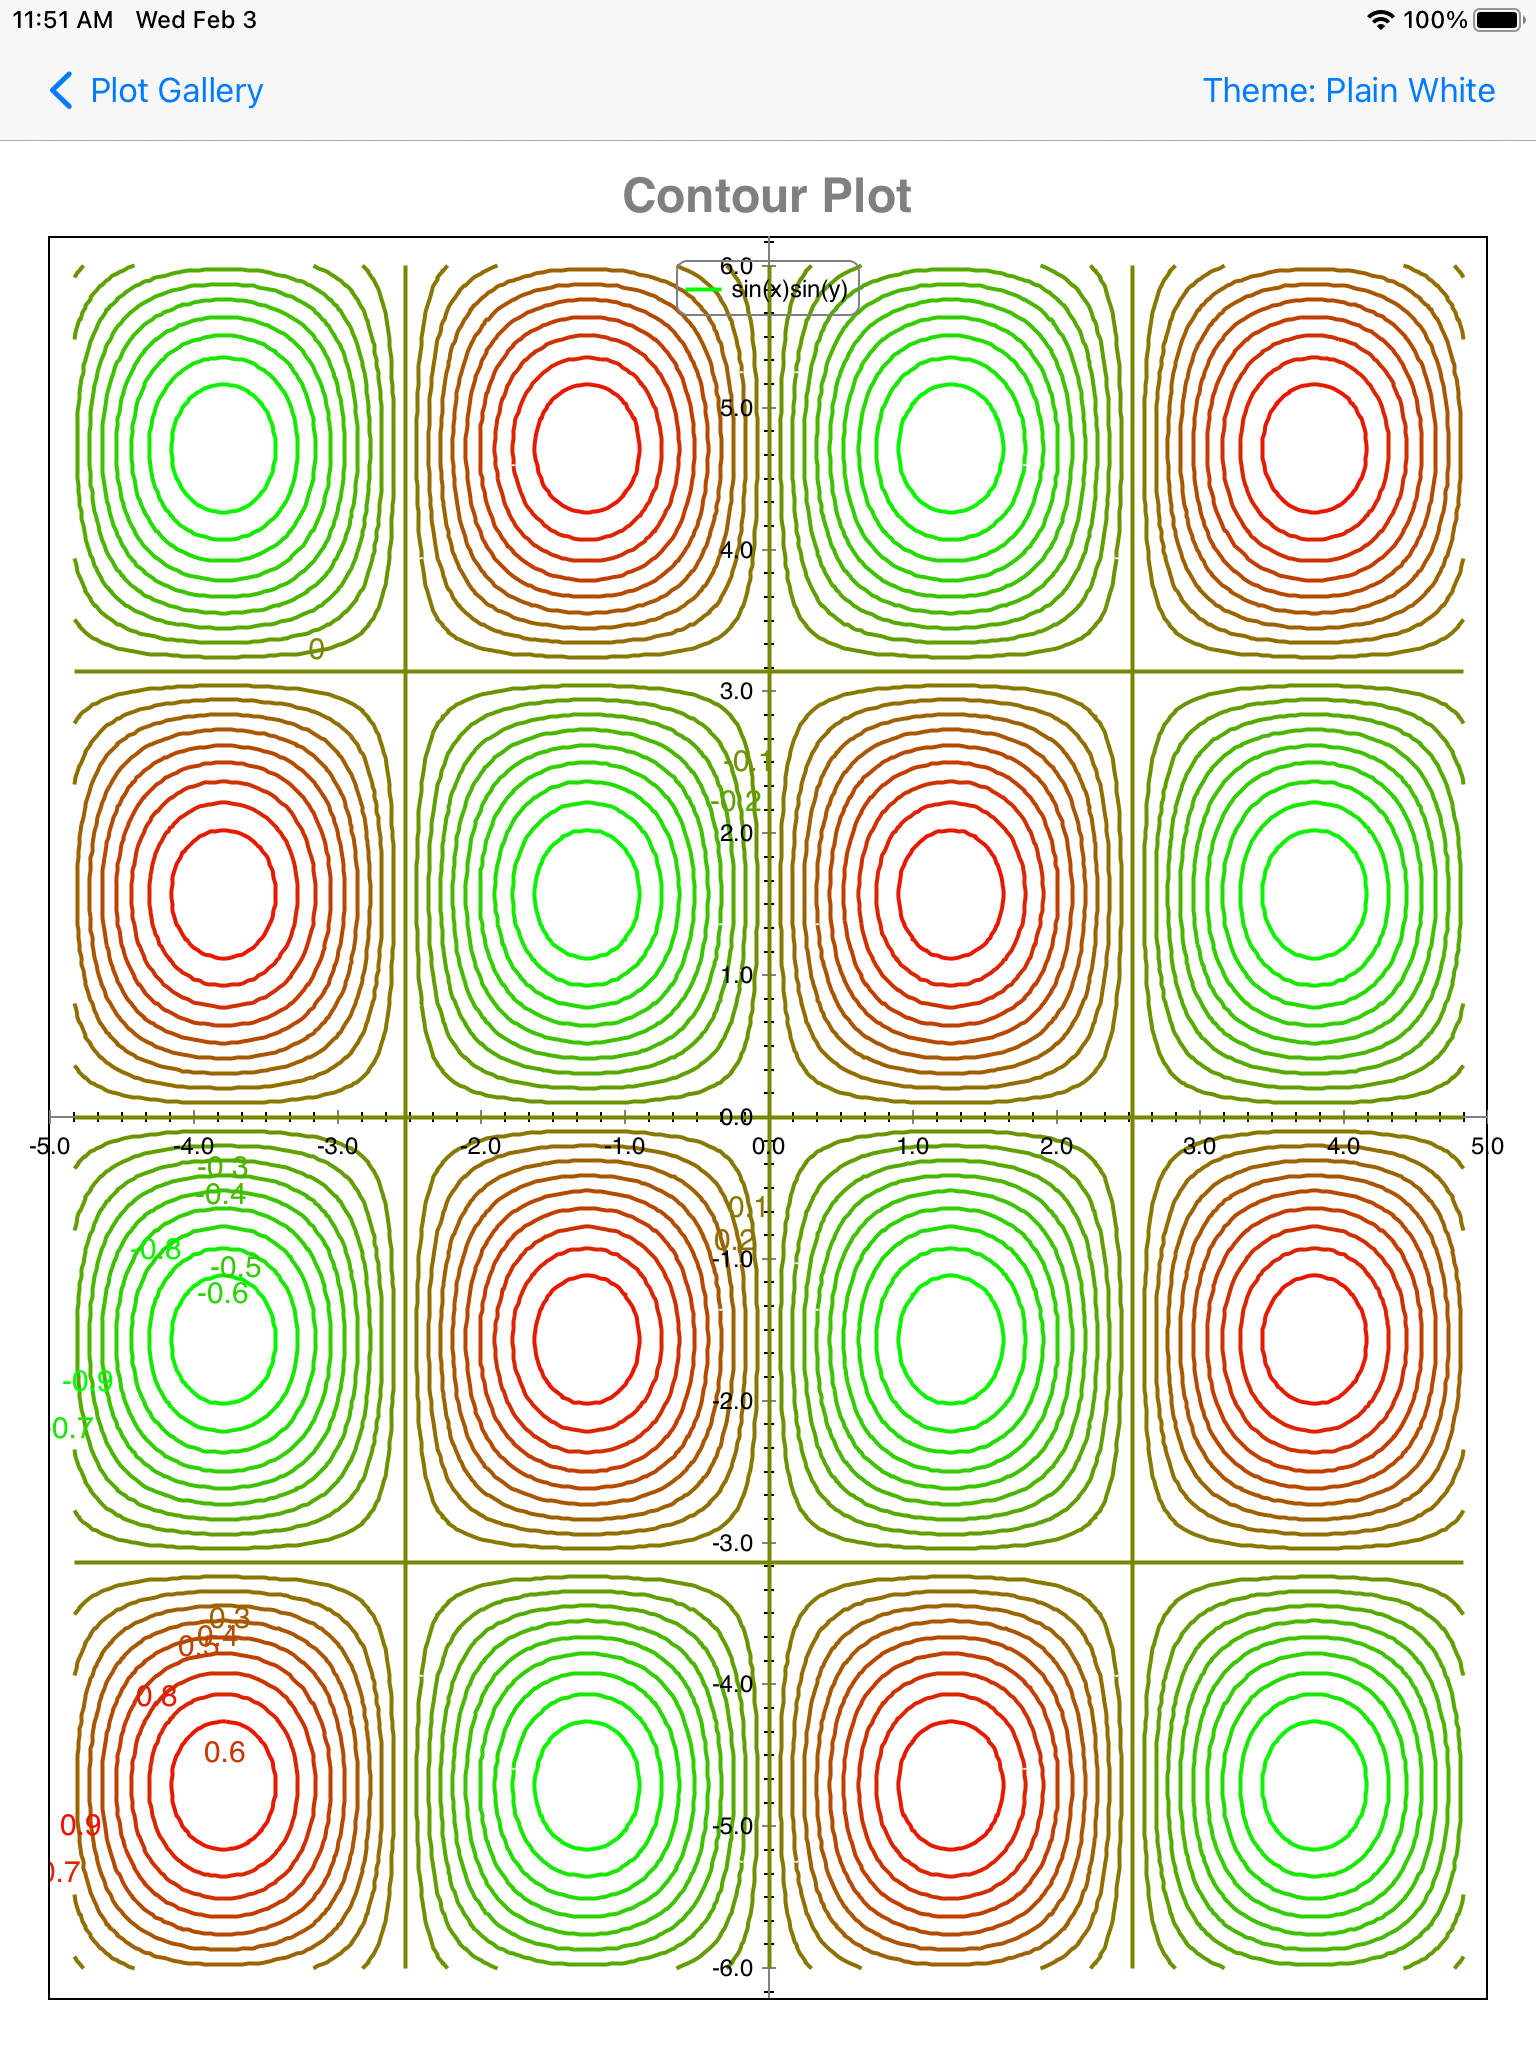
I've attempted to create Vector Field and Contour Plots... I created a branch(swainwri) and my files are under release 2.4. I've updated the Plot_Gallery to accommodate these examples. When I have tried to accommodate a continuous plot (+inf or -inf) for x & y's I run into difficulties. Rather than inserting and growing the cached data, I move data along and replace the data required, this sometimes gets out of sync. Appreciate someone just running over this as I'm spending too much time on this.
eskroch commentedon Feb 5, 2021
I played with your implementation a bit. Nice work. A few comments about the continuous plot:
-plotSpaceChanged()doesn't account for zooming out. It never updates the newly exposed data points around the original data. You can zoom using a pinch gesture on the Mac (using a trackpad) and on iOS.eskroch commentedon Feb 14, 2021
Please submit a pull request to add these new plot types when you feel they're ready.
swainwri commentedon Feb 25, 2021
Just added filling between contours, however I'm not happy with it, clipping CGContext etc seems to be the bane of my programming hobby. At https://scialert.net/abstract/?doi=jas.2014.368.373 one can pull across a pdf which appears to describe how I have attempted the filling between isocurves. I'm trying to make a stencil and not sure I'm getting it, perhaps someone could take a look. I've uploaded a new version of the ContourPlot example.
swainwri commentedon Jul 24, 2022
I had a long interlude looking at filling in between contours, however recently revisited it. If one wishes to use delaunay triangles or kriging to interpolate on raw data, there can be quite sometime whilst the contour algorithm processes this data.
I need to have an activity indicator advising user, during this time. I saw your stackoverflow answer 11 years ago, so worked on those lines. https://stackoverflow.com/questions/7576206/core-plot-show-loading-spinner/7576799#7576799
I looked at this 2 ways, creating an indicator within CPTContourPlot class using CPTLayer, with sublayers having a message layer and an animated indicator above. Still the problem these layers don't show till after rendering, and with the cleaning up in didFinishDrawing(_ plot: CPTPlot), one never gets to see the indicator. The other way was to create an activity indicator Block neither does the trick and assigning it when one has changes to the contour plot.
The issue must be on threads, and i've no idea where to look next.
I converted the c++ code for contouring to objective c, and had to include a bunch of c heap memory management routines.
My branch for coreplot on github is not up to date, seems my understanding of making it so is minimal.
swainwri commentedon Aug 5, 2022
Managed to upload my version of core-plot, on swainwri/core-plot branch release-sw. see example ElevationPlot. Note I still have a problem filling on certain function ie last in function list.
Couldn't to get XCode to upload, managed with a mixture of Desktop for Github and manual uploads. XCode on every upgrade becomes more and more flawed, debugging is becoming a nightmare.