Repository navigation
Scatterplot in Dataframe #8
Description

I'm trying to draw scatter plot of the following dataframe but it misses some points.
df = Daru::DataFrame.new({
  x: [3, 3, 3],
  y: [1, 2, 3]
  }, index: [0, 2, 3])
Plot.new [df, pt: 6, ps: 1, using: '2:3']
Although if I do not specify any index then it works pretty well.
Activity
lokeshh commentedon Jun 23, 2016
BTW, I'm not sure what
usingoption does? Could someone tell me or point in the direction where I can read about it. Thanksievgrafov commentedon Jun 25, 2016
You may take a look at the option description in Gnuplot doc (http://www.gnuplot.info/docs_5.0/gnuplot.pdf , p.91).
In your case it tells Gnuplot to use 2-nd (as x) and 3-rd (as y) columns (1-st column is index, 2-nd is x and 3-rd is y for you datasheet) to plot you graph.
Please attach graphs, you're getting as a result in both cases.
lokeshh commentedon Jun 26, 2016
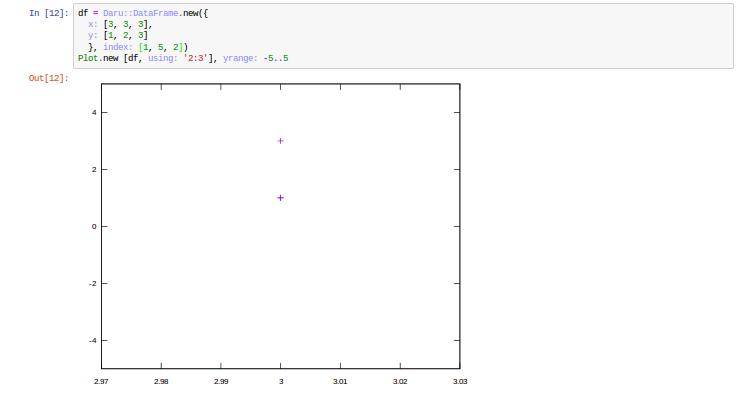
Here's the image when I set a index different than default:
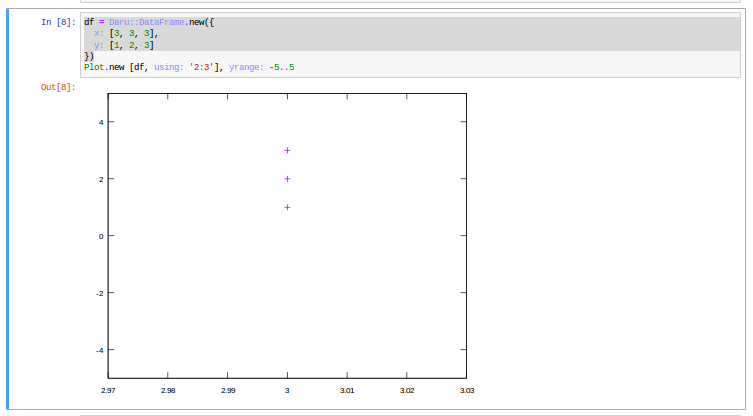
and here's the image when I use the default index: