


Abstract
Electrification with heat pumps is often cited as a preferred pathway to decarbonize US space heating in the transition to a net-zero energy system. However, fully electrifying building heat may significantly increase peak electric system loads during cold weather, thus challenging extensive adoption. A hybrid home heating system uses both heat pumps and conventional natural gas furnaces, where the gas appliance operates during peak heating periods. Here, we assess the marginal abatement costs of fully electrifying peak heating demands as opposed to allowing hybrid heating in current gas connected and ducted homes. We use a least-cost energy system optimization model that considers household, electric, and gas system costs, including electric distribution system expansion and gas system cost recovery. To ensure the cost of sufficient low-carbon dispatchable electric capacity is captured, the model includes historical days with peak heating demands and low wind and solar availability. We find hybrid heat pumps can achieve substantial decarbonization, with US natural gas residential heating consumption decreasing 70% to 95% from 2020 levels at marginal abatement costs below $200 per tonne CO2e. The cost of fully electrifying heating in cold regions is very high, with the marginal abatement cost of eliminating the last 1% of natural gas consumption exceeding $1000 per tonne CO2e even in scenarios designed to be favorable to electrification. The robust value of hybrid heat pumps in northern cold climates indicates the importance of flexible building heat decarbonization policies such as clean heat standards.

Original content from this work may be used under the terms of the Creative Commons Attribution 4.0 license. Any further distribution of this work must maintain attribution to the author(s) and the title of the work, journal citation and DOI.
1. Introduction
More than half of US households use natural gas to heat their homes [1], and residential space heating (RSH) accounts for 7% of US greenhouse gas (GHG) emissions [2]. Electrification with heat pumps is often cited as a preferred pathway way to decarbonize US space heating in the transition to a net-zero energy system [3–9]. The ‘Electrify Everything’ movement, which includes strategies in which fossil fuel appliances are converted to electric, and low-carbon electricity generation replaces higher emission sources, is gaining influence in energy and climate policy [10–12]. For example, in California and New York, policymakers and regulators are proposing sales bans on new fossil-fueled heating equipment by 2030 or 2035 [13, 14]. However, fully electrifying building heat would significantly increase peak electric loads during cold weather [6, 15–18], thus challenging extensive adoption. In many cases, constructing new electric generation, transmission, and distribution capacity will be required.
Previous studies justifying the cost-effectiveness of complete residential heating electrification have often overlooked peak heating load implications and associated costs. Household-perspective studies on heat electrification do not account for increased electric system capacity costs [2, 19, 20]. Additionally, many system-level studies underestimate the magnitude of peak electric load increases by modeling the heat pump coefficient-of-performance (COP)7 as a static nominal or seasonal average value [7, 9, 21]. In reality, heat pump COPs decline at low temperatures, and the device may switch to or supplement with resistance heating [6]. This leads to non-linear increases in electric load as colder weather demands a higher heating load that is met by declining efficiencies [18]. With improved accounting for COP temperature dependence, Waite and Modi [6] find that the peak residential and commercial electric load would more than double in 23 states and increase 70% over the contiguous US, even assuming US-wide installations of very efficient cold-climate heat pumps, which retain higher efficiencies at lower temperatures than lower cost models.
Further, existing studies often do not account for cost tradeoffs between household heating equipment and electric system expenditures. Instead, they tend to exogenously specify [4, 9] or use a discrete choice model [22] to determine electric demand scenarios (e.g. rate of heat pump adoption by region), then optimize for the lowest cost electric supply. These approaches to choosing end-use equipment make it difficult to determine the least-cost pathway from a societal perspective since costs across the energy system are not co-optimized.
An alternative to fully electrifying residential heating is using hybrid heating systems. Within a household, hybrid heating systems combine heat pumps with fueled heating equipment, e.g. a gas furnace. The heat pump meets most of the annual heating demand but switches to or is supplemented by fueled heating equipment during the coldest periods of the year. This approach can limit peak electric loads while substantially reducing annual gas usage and GHG emissions. Hybrid systems are commercially available, and the furnace and heat pump can be installed with a shared air handler to reduce the equipment cost and installation footprint [23, 24].
The technical potential of hybrid heating systems to reduce GHG emissions may be significant. If hybrid cold climate heat pump systems were installed today in every home, Waite and Modi [6] estimate that heating from fossil fuels can be reduced from meeting 70% of US heating loads to only 1%–3% without requiring additional electric capacity at a census track resolution. Such a system benefits from using the existing gas delivery system to meet peak heating demand. This reduces the electric capacity required for full electrification, which may be needed only for a handful of the coldest days each year [6]. However, since hybrid heating systems require integrating both fueled heating equipment and heat pumps, they are more expensive for households to install than either individually and require multiple energy delivery infrastructure systems. Determining the appropriate role of hybrid heat pumps therefore requires an integrated model that internalizes the dynamics of both supply and demand side technologies.
Here, we assess the ability of hybrid heat pumps to cost-effectively decarbonize US residential space heating. We use the open-source and peer-reviewed Tools for Energy Model Optimization and Analysis (Temoa) energy system model with the Open Energy Outlook [25–27] characterization of the US energy system to evaluate the implications of hybrid heat pump adoption. We extend Temoa to capture peak electric loads from heat pumps more accurately by accounting for temperature dependent COPs. To assess uncertainty, we conduct a bounding analysis with assumptions alternately favorable to electrification or to fuel use in hybrid heat pumps. This study builds on the technical potential study of hybrid heat pumps conducted by Waite and Modi [6] but is the first study to consider the cost-effectiveness of hybrid heat pumps while simultaneously considering other energy supply and demand infrastructure.
We find that in northern regions, hybrid heat pump installations achieve significant annual decarbonization benefits at modest marginal abatement costs. However, even when assuming favorable input parameters for electrification, the marginal abatement cost of fully electrifying peak heating demands in colder regions is very expensive, exceeding $1000 per tonne of CO2e. The cost-effectiveness of hybrid heat pumps compared to full electrification is less clear in warmer regions, where the results are not robust to uncertainties in key input values like electric distribution capacity upgrade costs.
2. Methods
Temoa is a least-cost energy system optimization model, which co-optimizes investment and operational decisions in the energy supply, conversion, and end-use sectors [25, 26]. We chose Temoa due to its ability to internally capture electric capacity expansion costs, residential heating technology costs, and operational costs as well as hourly time resolution. Temoa is in a similar model class as the MARKAL/TIMES [28], OSeMOSYS [29], and MESSAGE [30] models. The model minimizes discounted total system cost, comprising capital, operating, and fuel costs across all sectors subject to physical and policy constraints. We build on the US dataset developed for the Open Energy Outlook project for the Lower 48 states [27, 31], which includes 51 distinct energy service demands, hundreds of technological processes, and represents the Lower 48 as nine regions. The model regions were selected to aggregate states into regions that align to the extent feasible with electric generation interconnections and regional transmission organizations (figure 1). The model optimizes over a period of 2020–2050 in five-year increments, with each increment optimized myopically for computational tractability (i.e. without foresight of future periods; see appendix
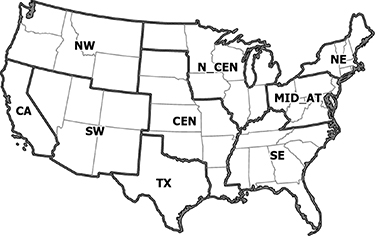
Figure 1. Temoa regions.
Download figure:
Standard image High-resolution imageWe model energy system decarbonization through three mechanisms operating simultaneously. The model first implements a sales ban starting in 2030 on fueled heating equipment, such as gas furnaces, propane furnaces, and fuel oil boilers: all new installations must then be heat pumps or electric resistance. This is similar to the aforementioned policies proposed in California and New York. Hybrid heat pumps are permitted, which may or may not follow sale ban policy implementations. The second mechanism is a carbon price on residential heating fuels, including natural gas, fuel oil, and propane. This is varied between model runs from $0 to $1000 per tonne CO2e, and for natural gas includes upstream methane emissions. Emissions from residential natural gas consumption are not fully abated. Combined, these two model mechanisms allow us to infer the marginal abatement cost of electrifying increasing amounts of natural gas heating. The increasing carbon price drives fewer hybrid heat pump installations and less gas use in those that are installed, requiring the heating demand to instead be met by all-electric heating technologies. Within each model run, the same carbon price in real dollars applies for the periods 2025–2050. The third mechanism is a constraint that requires GHGs in the rest of the energy system to decline to net zero by 2050. This constraint is necessary to capture interactions between residential heating and decarbonization in the rest of the economy, particularly regarding the availability of wind and solar generation for electric heating needs in a decarbonized electric grid. This reflects the assumption that political backing for the substantial decarbonization of residential heating would not continue in the absence of political backing for economy-wide decarbonization.
To assess the robustness of our results given significant uncertainty in input variables over time and between regions, we perform a bounding analysis by modeling an electrification-favorable scenario and a fuel-favorable scenario. In each scenario, we vary six parameters simultaneously within their margin of uncertainty but tilted toward making either full electrification or hybrid backup fuels to be more cost-effective. We summarize the scenarios in table 1.
Table 1. Scenario policies and costs.
| Scenario | Electric distribution CAPEXa | Cost difference between low- and high-efficiency heat pumpsb | Methane emission ratec | Grid-scale battery CAPEXd | Hybrid cost differencee | Gas pricef |
|---|---|---|---|---|---|---|
| Electrification-favorable | $250 per kW | $1700 | 4%, declines 30% to 2.8% by 2050 | $345 per kW by 2050 | $1000 | $6.37 per GJ in 2050 |
| Fuel-favorable | $2500 per kW | $4000 | 2.3%, declines to 0.5% by 2050 | $980 per kW by 2050 | $500 | $2.78 per GJ in 2050 |
aApplied to regional capacity expansion after the base model year. Distribution CAPEX ranges are approximately the 25th and 75th percentile of PG&E’s individual distribution project costs [35], modeled as the average future project cost. bShown for 3 ton heat pump. The value in the electrification-favorable scenario is based on NEMS input data [32]. A higher cost difference leads the model to deploy fewer high-efficiency heat pumps, making both peak and annual electric loads higher. cA 2.3% leakage rate is reported by Alvarez et al [36] but higher values have been found in some regions [37, 38]. A reduction to 0.5% emission rate is intended to be an optimistic view of possible emission reductions. A 30% reduction is the US target to be achieved by 2030, and a reduction from 4% to 2.8% is intended to represent a high bound for current methane emissions with relatively low future methane reductions [39]. dFor 4 h batteries, from the NREL Annual Technology Baseline advanced and conservative cases [40]. 8 hour batteries are also modeled, with costs derived in the same method. eAdditional cost of the hybrid heat pump relative to the all-electric heat pump of the same efficiency and capacity. The electrification-favorable value includes the full equipment cost of a 80% AFUE gas furnace [32] (the modeled backup furnace efficiency). The fuel-favorable value reflects the difference between all-electric and hybrid costs [41], which can be lower than the standalone furnace cost when sharing an air handler with the heat pump to avoid duplicate equipment and reduce the installation footprint. fBased on real gas prices from the scenarios of EIA’s AEO 2023 modeling with the highest (Low oil and gas supply) and lowest (High oil and gas supply) prices [42].
To align with the total resource cost perspective of an energy system optimization model, we include gas and electric infrastructure costs in the model as capital and fixed costs, not as variable costs. This more closely follows how distribution and transmission costs are incurred but differs from typical retail rate design. Electric distribution capacity costs are reported in table 1. We include fixed electric distribution, transmission, and administrative costs of $87 kW−1 yr [43]. This infrastructure cost characterization provides a first-order representation of electric network capacity expansion costs. Electric generation existing capacity by installation year and new installation costs are adopted from the Open Energy Outlook database [44]. The generation cost data was originally derived from NREL’s Annual Technology Baseline [40].
Since gas infrastructure expansion to currently unserved customers is not well specified within our modeling framework, residential gas infrastructure capacity is constrained to the peak coincident gas load of the existing building stock by region, as calculated using the NREL End Use Saving Shapes (EUSS) data [45]. It has the effect of electrifying any incremental building heat service demands beyond the base year. Relaxing this constraint would allow more natural gas heating equipment to be installed in 2025 at low carbon prices. We also limit the deployment of hybrid heat pumps to the existing natural gas connected and ducted housing stock, which assumes that the primary residential hybrid heating backup equipment will be a furnace and that buildings not already connected to the gas network would not become connected to install a hybrid heat pump. This varies from 35% to 73% of the existing housing stock installed capacity, depending on the Temoa region (appendix
Several improvements were made to the Temoa model to enhance the characterization of the residential heating sector. Where Temoa previously used a static heat pump COP for all model time periods, we incorporate the temperature-dependence of air source heat pump efficiency using the EUSS database [45]. We include both heat pump efficiencies modeled in EUSS, a standard efficiency model and a high efficiency cold climate model [46]. The high efficiency model is intended to represent the best performance currently available and is a significant improvement over current typical installations (see appendix
These heat pump representations are also used as the basis for the hybrid heat pumps, where we give Temoa the ability to cost-optimize the hourly deployment of hybrids between the heat pump and an 80% annual fuel utilization efficiency (AFUE) natural gas furnace in exchange for a higher installation cost (table 1). This allows the modeled hybrid heat pumps to switch to natural gas not only at lower heat pump electric efficiencies, but also to respond to periods of high electric grid demand or low wind and solar generation. We use this modeling technique instead of a switchover outdoor temperature due to a lack of data in the EUSS dataset on hybrid high efficiency heat pump fuel use. This more responsive hybrid heating representation we model would in practice require aligning consumer financial incentives to electric grid conditions through mechanisms such as rate reform, demand response programs, or virtual power plants.
For computational tractability, Temoa uses a representative days approach to reduce the model time resolution, while maintaining the seasonal and diurnal variability inherent in energy demands, like space heating and cooling, as well as supply options like wind and solar [48]. Representative days are modeled as 24 contiguous hours. We select thirteen representative days from the 2012 weather year focusing on ensuring residential space heating, space cooling, wind, and solar annual profiles are well represented. We also select days that capture peak heating and cooling demands, including days of relatively low wind and solar production. This approach results in representative days that reflect both peak heating and cooling demands and the variability in demand and wind and solar generation (see appendix
3. Results
Hybrid heat pumps have the potential to reduce US-wide natural gas consumption for home heating 45%–95% by 2050 at marginal abatement costs between $50 and $200 per tonne CO2e (figure 2). This corresponds to decreases in residential heating fuel emissions of 68%–96% after accounting for methane emissions (see appendix
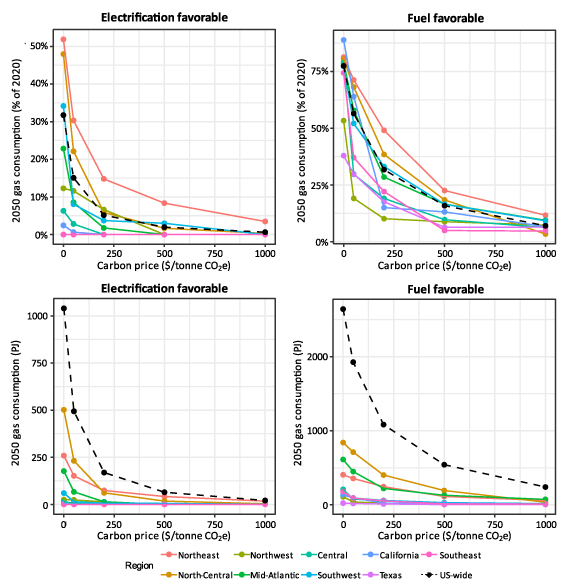
Figure 2. Natural gas residential heating fuel consumption in 2050 shown as a percentage of 2020 consumption (top) and in PJ (bottom) from both the electrification-favorable (left) and fuel-favorable (right) scenarios. Modeled carbon prices are $0, $50, $200, $500, and $1000 per tonne CO2e. Note the differing y-axis scales.
Download figure:
Standard image High-resolution imageThe marginal abatement cost of electrifying the last few percent of cold region peak heating demand is very high even in the electrification-favorable scenario; the marginal abatement costs of eliminating the last 4% of Northeast 2050 gas demand relative to 2020 consumption exceeds $1000 per tonne CO2e. In the fuel-favorable scenario, all regions maintain some peak heating gas consumption at prices of $1000 per tonne CO2e, with 9% of 2020 nation-wide gas consumption remaining in 2050. This indicates the very high marginal costs of providing sufficient firm electricity supply and building electric distribution capacity to meet peak heating demand peaks. At a carbon price of $0 per tonne CO2e, nation-wide residential heating natural gas consumption falls 68% (electrification-favorable) and 23% (fuel-favorable) due to the sales bans on non-hybrid fuel burning equipment. Residual GHG emissions from residential heating fuels including natural gas upstream methane emissions are shown in appendix
Hybrid heat pumps provide value in colder climates that is robust to our bounding analysis. Figure 3 shows the installed heating capacity shares over time in the electrification-favorable case for each region and modeled carbon price from $0 to $1000 per tonne CO2e. Following fueled equipment sales bans starting in 2030, all regions transition to heat pumps of some kind over time as existing equipment stock reaches the end of its lifespan. Even in this electrification-favorable case, colder regions install hybrid heat pumps at high rates; the North-Central and Southwest (including Colorado and Utah) regions install the maximum constrained hybrid capacity in 2050 at low carbon price levels and the Northwest and Northeast install the maximum constrained hybrid capacity up to carbon price stringencies of $200 and $500 per tonne CO2e (see appendix
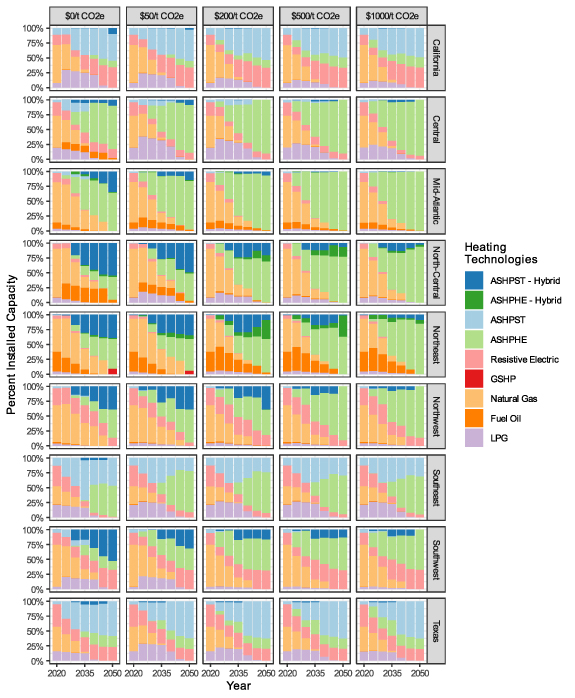
Figure 3. Residential heating equipment shares for the electrification-favorable scenario over time by region (rows) and carbon price (columns). ASHP indicates air source heat pumps, while ST and HE indicate standard and high efficiency respectively. Heat pumps begin to take over market share in all regions when the fueled equipment sales ban starts in 2030. Hybrid heat pumps retain substantial market share in colder climates, even at high carbon prices.
Download figure:
Standard image High-resolution imageThe benefit of avoided electric capacity is demonstrated in figure 4 for the three regions with the highest installed hybrid capacity in the electrification-favorable scenario. As hybrid heat pump capacity increases, required electric capacity decreases, representing substantial savings. Changes in electric capacity are attributable to less electric capacity required during peak heating demands, changes in types of electric generation that have different capacity factors, and changing heat pump efficiencies between carbon prices.
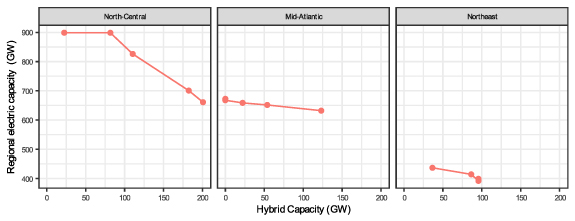
Figure 4. Relationship between regional hybrid capacity and electric generation capacity in 2050 for the regions with the highest hybrid capacities.
Download figure:
Standard image High-resolution imageAs expected, the installed capacity of hybrid heat pumps in colder regions is higher in the fuel-favorable scenario (figure 5). Since hybrid capacity is constrained to the existing housing stock with a gas connection, the model also installs significant quantities of ground source heat pumps, despite their large capital expense, because they significantly decrease peak electric loads compared to air source heat pumps.
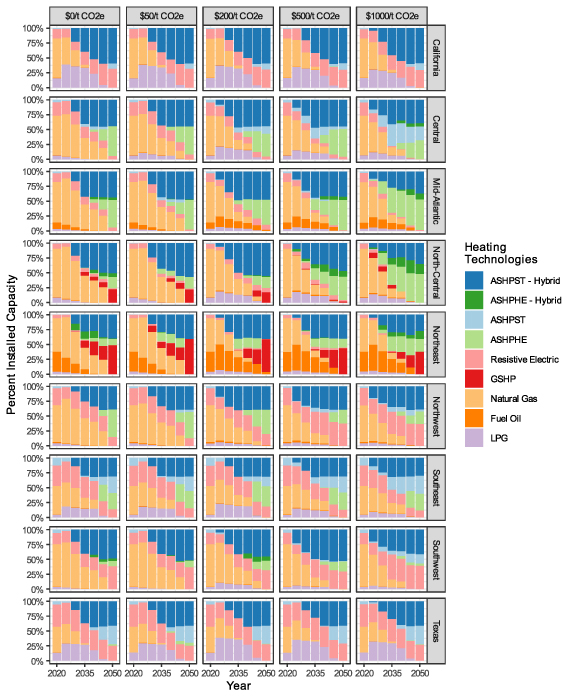
Figure 5. Residential heating equipment shares for the fuel-favorable scenario over time by region (rows) and carbon price (columns). ASHP indicates air source heat pumps, while ST and HE indicate standard and high efficiency respectively. Heat pumps begin to take over market share in all regions when the fueled equipment sales ban starts in 2030. In this scenario, the peak reduction benefit of hybrid heat pumps provides sufficient value in all regions to justify their installation.
Download figure:
Standard image High-resolution imageThe value of hybrid heat pumps is less certain in warmer regions. In the electrification-favorable scenario, little to no hybrid heat pump capacity is installed in the California, Central, Southeast, and Texas regions (figure 3), but significant hybrid heat pump capacity is installed in all model regions in the fuel-favorable scenario (figure 5). Given the lack of robust findings in warmer climates, narrowing this uncertainty will be critical for policymakers in warm regions to determine cost-effective heating decarbonization methods.
4. Discussion
Hybrid heat pumps in cold climates offer the potential to avoid the costs associated with large coincident electric loads while substantially reducing fuel consumption and system-wide emissions. The high abatement costs that we find are required to electrify peak heating in cold regions indicate how difficult full building heat decarbonization could be.
The robust value of hybrid heat pumps in cold climates indicates the importance of building heat decarbonization policies that permit hybrid heating technologies. The fueled heating equipment sales bans, currently being pursued in California and New York [13, 14], would not allow for the benefits of avoided electric capacity from hybrid heating after existing fueled heating equipment is retired unless an explicit exemption is made to allow gas heaters as part of a hybrid system. In addition, proposed regulations in Massachusetts would give hybrid systems only half the emissions reduction credits as fully electrified systems and phase in requirements for full electrification over time [50]. Our findings show that cold regions, including New York and Massachusetts, should consider allowing such flexibility to reduce electric grid stress during the coldest winter days and accurately accounting for the emission reductions in any credit systems. Clean Heat Standards like those currently pursued in Colorado and Vermont [51, 52] are a more technology-neutral policy mandating emission reductions from space heating over time, but allowing flexibility in the technologies used to achieve these reductions.
Allowing hybrid heat pumps may also increase the public acceptance of heating decarbonization policies compared to a strict fueled equipment sales ban due to lack of public familiarity and public perceptions of heat pump performance, especially in cold weather [53].
For hybrids to lead to substantial decarbonization while not straining electric grids during peak heating demands, household incentives need to be better aligned with larger energy system cost occurrence and climate impacts. There are currently two problems. First, private household economics do not favor heat pump adoption in many parts of the country [15]. Existing policies have primarily focused on improving the installed costs of heat pumps relative to status quo alternatives [54]. In colder parts of the country, due to declining heat pump efficiencies at lower temperatures the operating costs of heat pumps can also be higher than a natural gas alternative through much of the winter [55]. This undermines the economics of both hybrid and all-electric heat pumps, and for hybrid heat pumps can lead to switchover temperatures from the heat pump to the backup gas furnace being set at relatively mild temperatures, causing only modest reductions in natural gas use (see appendix
For operating the heat pump to be cheaper than using the backup gas furnace most of the time, retail electric rates should be decreased through much of the year while increasing them during grid stress. Real-time pricing or critical peak could be used [56]; a framework with a more salient driver for households could be the temperature-dependent retail rates created by Hydro Quebec for hybrid heat pumps. The residential rate decreases from the typical retail rate of 6.704¢ kWh−1 to 4.818¢ kWh−1 ($CAD) above −12 or −15 deg C (depending on the region), and increases them to 28.173¢ kWh−1 ($CAD) below this temperature which occurs only a few days a year [57]. Virtual power plant programs are an alternative that could provide households more flexibility in program design. Combining demand charges with lowered volumetric rates could also provide appropriate incentives. These approaches would ideally be incorporated within automated equipment controls. Natural gas prices can also be raised simultaneously to improve the relative economics versus electricity and incorporate the negative externalities of gas combustion. Gas pricing could include carbon pricing [58] or a renewable natural gas (RNG) blend may be required that raises the price of the blended gas stream [35, 59–61]. Failing to align household financial operational incentives with the need to operate the heat pump most of the year would substantially undermine the decarbonization benefits of hybrid heat pumps. Clean Heat Standards could be structured to hold utilities accountable for implementing the changes needed to achieve the necessary emission reductions.
The substantial declines in gas use shown in figure 2 makes decarbonizing the remaining gaseous fuel more feasible. For example, supply of low-carbon RNG such as captured methane is limited, with NREL estimating only 450 PJ of potential supply from landfills, waste, and wastewater [62], about 13% of US 2023 all-sector natural gas consumption. RNG and other low carbon fuels could therefore contribute to decarbonizing the remaining gas use shown in figure 2. Other hard-to-decarbonize sectors would also compete for this limited supply, however, the marginal abatement costs we find for full electrification in cold climates indicate that RNG used for peak heating decarbonization can compete with these sectors. Continued use of methane combustion, regardless of origin, will also require minimizing methane leakage along the supply chain [63].
Substantial decreases in gas use due to heating electrification will require substantial changes to gas utility cost recovery mechanisms and coordinated planning between gas and electric utilities. Under the existing cost-of-service paradigm, as gas throughput shrinks gas utilities would charge more on a per unit basis to cover the costs of maintaining and operating their systems and recover previous investments. A full electrification pathway would likely see these increasing gas rates borne by renters or low income customers with less ability to electrify [64]. Increasing gas rates could be partially mitigated by avoiding new expenditures required for gas distribution pipeline replacements or capacity expansion through targeted electrification, often called non-pipeline alternatives, which would preclude hybrid heat pumps for affected customers [65]. These have elsewhere been shown to be very cost-effective to achieve decarbonization [66], but their effective scale is limited by the pipeline replacement rate and hydraulic feasibility and alone would complement rather than substitute hybrid deployment elsewhere in the system [67].
Continued use of the gas system for hybrid heat pumps would require operation and maintenance costs for longer, but also allows for additional gas system revenue and prevents additional investment in the electric system without stranding previous investments in the gas system. Our modeling finds that continuing to operate at least some of the gas system for hybrid heat pumps is the least system cost outcome in colder regions except at very high carbon prices. In the medium- to long-term, a hybrid pathway will require alternative cost recovery, rate design, and utility revenue decoupling to align the benefits and costs of the continued operation of gas networks [68]. One innovative cost recovery model being implemented in Quebec would see the electric utility paying the gas utility for the value of the avoided electric capacity compared to full electrification [69, 70]. This might be done without increasing electric rates, since hybrid heating increases electric capacity factors [6]. This upholds the core principle of current utility planning practice that first determines a least cost pathway to meet energy demands and social goals then determines appropriate cost allocation for that least cost pathway, while evolving the analysis boundaries to include both gas and electric utilities. Our modeling implies there would be a large benefit from conducting cross-utility planning and cost allocation holistically rather than in silo, as indicated by the high avoided marginal costs of full electrification in northern regions caused by substantial electric system investments.
Likewise, if residential gas consumption shifts to only peak demand periods while overall gas production (of both fossil and renewable sources) falls, further exploration is necessary of the operational effects on gas storage and pipeline hydraulics. Gas storage may be called upon to make faster withdrawals during peak events, as there will be lower gas production in future years.
Some model limitations may undervalue the avoided electric capacity value of hybrid heating. Most significantly, the representative days approach used to reduce the time-dimensionality of the model may underestimate peak heating demands during periods of low wind and solar output despite our best attempts to account for them (see appendix
By contrast, other emerging sources of electricity system flexibility and peak load reductions may diminish the flexibility value of hybrid heating. Most notably, electric vehicle managed charging and vehicle-to-grid services [77], low-cost long-duration electric storage [78], and building thermal storage could decrease the benefits of hybrid heat pumps. In addition, allowing the model to fully optimize fuel switching between the electric heat pump and gas heater assumes feedback from grid conditions to the residential level similar to a virtual power plant. Current hybrid installations tend to switch between fuels at a given outdoor temperature setpoint. The additional flexibility benefit of the modeled approach therefore assumes additional sophistication in such grid to household feedback mechanisms, and associated incentives, are developed over the modeled timeframe. Another limitation is that we do not consider the health effects of criteria pollutants from the electric or residential sectors [15, 16]. Building envelope upgrades are also not considered. A recent paper shows they could provide peak reductions at a cost of $3900 kW−1 [79]. This is over three times the capital cost of hydrogen turbines in our model, though the shell retrofits would provide value at other times of the year and do not have associated fuel costs.
By using summary values for the US building stock derived from the NREL EUSS database, our results may also differ from a cost-optimal approach containing a more granular building stock representation [15]. Lastly, the system cost optimization perspective is not intended to reflect cost-minimizing choices from a consumer perspective under current rate design paradigms that include capital costs in volumetric rates. This can result in technology choices that would be less preferred under current rate design in some regions but that the model finds cost optimal from a societal perspective. For example, electric resistance capacity increases in California despite high volumetric rates in the state, since the state is summer peaking and in the model electricity consumption is priced at its production cost.
5. Conclusion
Hybrid heat pumps provide substantial value in cold climates by avoiding substantial peak electrification costs. The marginal abatement costs associated with fully electrifying peak space heating rival those of hard-to-abate sectors. Colder states should implement flexible building heat decarbonization policies such as clean heat standards that allow for the benefits of hybrid heating to be realized. The need for hybrid heat pumps in warmer areas is less certain, with the marginal cost of electrification varying substantially based on our input assumptions.
Acknowledgments
This research was supported in part by the Carnegie Mellon Electricity Industry Center and in part by the Carnegie Mellon Climate and Energy Decision Making Center (CEDM), formed through a cooperative agreement between the National Science Foundation and CMU (Grant SES-0949710). No funding agency had a role in writing, editing, or approving the publication of this research. A previous version of this work was included as one chapter in the doctoral dissertation of the lead author [80]. The authors declare that they have no known competing financial interests or personal relationships that could have appeared to influence the work reported in this paper.
Data availability statement
The data that support the findings of this study are openly available at the following URL/DOI: https://github.com/ssmil. The ‘temoa’ repository contains the model version used [33], the ‘oeo’ repository contains the database files [34], and the ‘Heating_decarb’ repository contains data manipulation and visualization files.
Author contributions
SS—Concept, methods, software, formal analysis, writing—original draft, visualization. CW—Methods, software. KJ—Methods, software. AV—Methods, software. AS—Methods, software. PV—Methods, writing—editing. JA—Resources, writing—editing, supervision.
Appendix A:
A.1. Myopic modeling limitation
For computational feasibility, each Temoa period is modeled myopically. For example, when optimizing for 2030, the optimization algorithm does not take into account changes in policy stringency and cost reductions in 2035 and beyond. In practice, limited foresight of these factors does exist, which the model does not capture.
The impact of this limitation on residential heating installations is low, as the residential sales ban policy does not change in stringency over time and heating appliance costs are also assumed to not change over time. (The model is mostly deploying heat pumps starting in 2030, so modeling evolving heat pump costs would only impact model results if the cost evolution differentially impacted standard and high-efficiency heat pump versions.) Further, since we assume that the heating fuel carbon price is constant between 2025 and 2050 within each model run, there is no inter-period effect.
Myopic modeling limitations may have a larger effect on the treatment of the electric system. However, the effect of this limitation is likely somewhat limited because a significant amount of electric system decarbonization is driven by the economics of declining wind/solar/storage prices. While modeling in a given time period does not account for future price declines, this is more realistic since future price declines are relatively uncertain.
A.2. Ducted/unducted housing split
Installing hybrid heating using existing technologies, which typically consist of a heat pump and forced air furnace, will be more difficult in existing homes that do not have air ducting. We assume that natural gas hybrids can only deployed in homes that have a gas appliance of any kind currently installed. As such, we constrain hybrid heating technologies to the existing ducted and natural gas-using housing stock. Table 2 is calculated from the NREL EUSS data [45] and shows that, depending on the region, 35% to 73% of the installed heating capacity is in eligible dwellings.
Table 2. Gas connected and ducted housing stock by Temoa region.
| By dwelling | By installed heating capacity | |||||||
|---|---|---|---|---|---|---|---|---|
| Number | Percentage | GBtu/h | Percentage | |||||
| Region | No gas/unducted | Gas & ducted | No gas/unducted | Gas & ducted | No gas/unducted | Gas & ducted | No gas/unducted | Gas & ducted |
| CA | 4815 | 9077 | 35% | 65% | 106 | 281 | 27% | 73% |
| CEN | 5629 | 4585 | 55% | 45% | 259 | 283 | 48% | 52% |
| MID_AT | 11 453 | 10 300 | 53% | 47% | 492 | 561 | 47% | 53% |
| N_CEN | 8262 | 11 126 | 43% | 57% | 384 | 685 | 36% | 64% |
| NE | 8517 | 6093 | 58% | 42% | 393 | 327 | 55% | 45% |
| NW | 3905 | 2200 | 64% | 36% | 119 | 110 | 52% | 48% |
| SE | 19 691 | 8515 | 70% | 30% | 761 | 412 | 65% | 35% |
| SW | 3508 | 4808 | 42% | 58% | 116 | 220 | 35% | 65% |
| TX | 6127 | 4298 | 59% | 41% | 228 | 214 | 52% | 48% |
Figure 6 shows the share of installed hybrid capacity in 2050 as a share of the maximum allowable capacity for the electrification-favorable scenario.
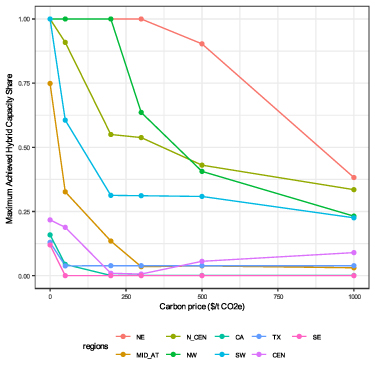
Figure 6. Installed regional hybrid capacity in 2050 as a share of maximum constrained hybrid capacity.
Download figure:
Standard image High-resolution imageA.3. Gas infrastructure revenue requirement
The residential share of the gas infrastructure revenue required is calculated from the AGA Gas Facts 2023 report [81], as shown in table 3. This is accounted for in the model to ensure that gas system costs are recovered if the widespread adoption of hybrid heat pumps means the gas system is relied on for peak capacity but has low annual throughput.
Table 3. Gas system revenue requirement calculation.
| Description | Amount | AGA gas facts 2023 location |
|---|---|---|
| Expenses | ||
| Total operating expenses distribution ($ millions) | 36 483 | Table 11–1 |
| Total operating expenses transmission ($ millions) | 5311 | Table 11–2 |
| Total operating expenses integrated ($ millions) | 3156 | Table 11–3 |
| Total operating expenses gas-electric ($ millions) | 22 262 | Table 11–4 |
| Purchase gas cost and production Exp ($ millions) | 26 489 | Table 11–5 |
| Total operating expenses less commodity costs ($ millions). Includes depreciation, retirements, depletion, and taxes. | 40 723 | Operating Expenses less purchased gas cost |
| Revenue requirement | ||
| Net gas utility plant (Total) ($ millions) | 284 459 | Table 11–6, 2021 |
| Return on rate base | 9% | Assumption |
| Revenue requirement | 66 324 | Net plant * return on rate base + Operating expenses incl. depreciation, retirements, depletion, and taxes. |
| Residential revenue share | ||
| Revenue from sales residential ($ millions) | 49 761 | Table 7–1, 2021 |
| Revenue from sales total ($ millions) | 77 666 | Table 7–1, 2021 |
| Revenue from transportation residential ($ millions) | 3874 | Table 7–1a, 2021 |
| Revenue from transportation total ($ millions) | 12 418 | Table 7–1a, 2021 |
| % of revenues from residential | 59.5% | Residential revenue share of all classes |
| Peak gas delivery | ||
| Gas delivery (PJ yr−1) | 35 314 | Temoa initial nationwide residential peak gas delivery |
| Fixed gas system cost calculations | ||
| Residential share of revenue requirement (M$ (PJ yr−1)−1) | 1.12 | Revenue requirement * residential share/gas delivery |
A.4. Efficiency of installed heat pumps in Massachusetts and California
Heat pump efficiency has improved in recent years and is credibly expected to continue to improve over the modeled time period. This raises the question of whether the modeled heat pumps may under or over estimate future heat pump efficiencies. As the future progress in heat pump efficiencies until 2050 is currently unknowable, we compare the modeled heat pump efficiencies to the efficiencies of recent heat pumps installations in California and Massachusetts where datasets are available (figure 7). The modeled heat pump efficiencies are HSPF 9 and HSPF 13/14, as adopted from the NREL EUSS database [45]. We see that HSPF 13/14 heat pumps are substantial improvements over the existing heat pump stock, and exceed the currently installed central heat pump technologies where the hybrid heat pumps are assumed to be used. The modeled High Efficiency heat pumps, available in each future model period at the same efficiency, therefore allows for performance improvement above the efficiency of models currently most commonly installed (ductless) or commercially available (ducted).
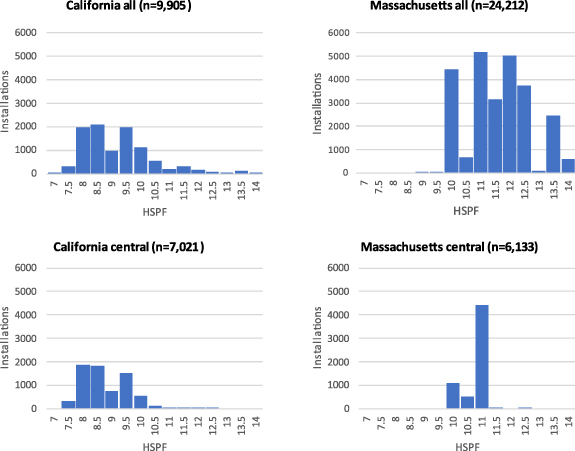
Figure 7. Installations of heat pumps in California (left) and Massachusetts (right). The efficiency of central heat pumps is lower than the full dataset that includes mini-split installations.
Download figure:
Standard image High-resolution imageWe determine the efficiency of Massachusetts heat pump installations using the Mass Save dataset by comparing the model numbers to AHRI data [82] to determine efficiencies. The model number entries from the MassSave database are aggregated into unique values. All model number entries with more than 10 installations recorded are matched to the AHRI heat pump databases, and the model HSPF is recorded. Most often, only the outdoor unit model number is reported in the MassSave database. HSPF can vary depending on what indoor unit the outdoor unit is paired with, though we found that the listed HSPF for each combination was generally the same, and when it was not the difference was on the order of 0.5 or 1.0 HSPF. We recorded the highest HSPF listed if there were any differences. We found efficiencies for the model numbers with the most installations, until we had found efficiencies for 98% of all installations. We assume individual heat pump equipment with a heat capacity greater than or equal to 2 tons is a central installation.
Data for California are from the TechClean dataset that required little pre-processing [83].
A.5. Representative days clustering
Representative days are selected using the k-means clustering approach described in [48] to represent the distribution of loads that the model considers to have time-varying demands. For k-means clustering of supply and demand distributions, a hierarchal weighting scheme is used to balance the need for accuracy between supply sources and demands. This is required as the number of distribution profiles in the dataset is somewhat arbitrary and not representative of their importance to the research question (table 4). If no weighting is done and each distribution is normalized between [0,1], then due to the very high numbers of wind and solar profiles everything else is implicitly weighted very low when choosing clusters by comparison. While this may lead to the differences in wind and solar generation cluster profiles in each region being well represented, other important profiles, like heating load, would not be.
Table 4. Representative days k-means clustering weighting scheme.
| Type | Supply/demand fraction | Technology | Entries | Technology fraction per supply/demand | Combined fraction | Normalization factor per entry |
|---|---|---|---|---|---|---|
| Supply | 0.5 | Hydro—conventional | 9 | 0.10 | 0.050 | 22.56 |
| Supply | 0.5 | Hydro—small | 9 | 0.10 | 0.050 | 22.56 |
| Supply | 0.5 | Wind—offshore | 4 | 0.10 | 0.050 | 50.75 |
| Supply | 0.5 | Wind—onshore | 609 | 0.40 | 0.200 | 1.33 |
| Supply | 0.5 | Solar PV | 609 | 0.30 | 0.150 | 1.00 |
| Demand | 0.5 | Heating—residential | 9 | 0.40 | 0.200 | 90.22 |
| Demand | 0.5 | Heating—commercial | 9 | 0.10 | 0.050 | 22.56 |
| Demand | 0.5 | Cooling | 18 | 0.25 | 0.125 | 28.19 |
| Demand | 0.5 | Other demands | 54 | 0.25 | 0.125 | 9.40 |
Therefore, supply and demands as a group are weighted 50:50. Within supply and demand respectively, each technology or demand grouping is assigned a weight corresponding to our subjective assessment of the importance for that group of ensuring a higher fidelity representation of the representative days to the annual variations.
In making this subjective assessment for demand, we considered the goals of our study when weighting heating (and to some extent cooling) demands high, that other demands have less seasonal variation and regular diurnal variations are inherently captured to some degree by the representative days approach, and that heating and cooling demands represent a large portion of residential energy consumption. Adequately modeling cooling is necessary to capture the air conditioning value of heat pumps compared to separate heating and air conditioning appliances. For supply, we considered the weekly and seasonal variability of technologies and relative contributions of each energy source modeled elsewhere in the literature.
The residential space heating (RSH), residential space cooling (RSC), and residential water heating (RWH) 8760 load profiles used in the clustering are from NREL’s EULP/EUSS database for 2012 [45]. Other load profiles are from NREL’s EFS project [71].
Figure 8 shows load duration curves of residential (prefix R) and commercial (prefix C) time-varying demands, comparing the representativeness of the thirteen representative days to the underlying full year hourly data. Given higher priorities assigned to matching RSH and RSC, these profiles are relatively well represented. Other abbreviations are for lighting (xLT), water heating (xWH), clothes drying (RCD), and dishwashing (RDW).
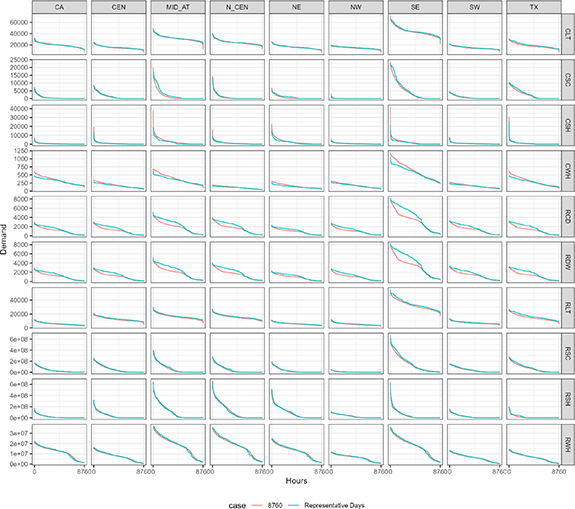
Figure 8. Representative day load duration curves compared to 8760 data. Columns are model regions, rows are time-varying residential and commercial end use demands. See text for abbreviations.
Download figure:
Standard image High-resolution imageFigures 9 and 10 show the daily capacity factor of wind and solar, respectively, and how these days compare to that day’s heating demand. The number of representative days that can be selected is limited by computational tractability. As the days selected through k-means clustering do not adequately represent peak heating days, especially peak heating days that are at periods of low wind and solar generation, we manually select additional days to ensure these periods are captured in the model. We also manually select peak cooling days to ensure that peak space cooling demand is well represented. This ensures that: (1) initially grid capacity will be sized for the summer peak, given relatively low initial levels of electric heating; and (2) the air conditioning value of heat pumps is captured given their higher capital costs relative to other HVAC technologies, including electric resistance heating after the fueled equipment sales ban becomes effective in 2030.
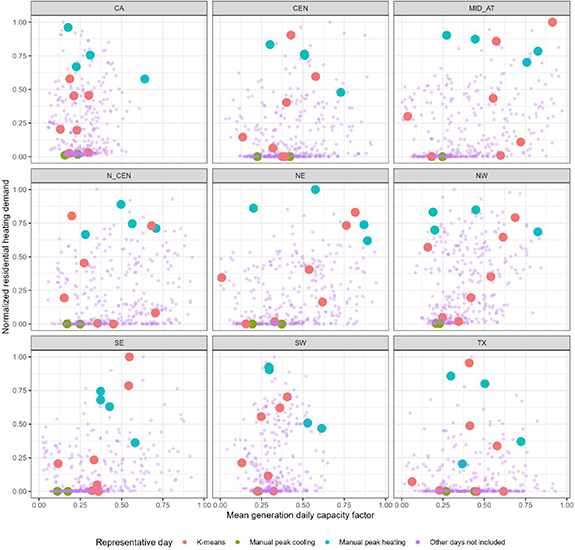
Figure 9. Daily wind capacity factor vs residential heating demand. Days in the top left of each subplot are particularly important to capture as they indicate days of high heating demand during days of lower wind production.
Download figure:
Standard image High-resolution image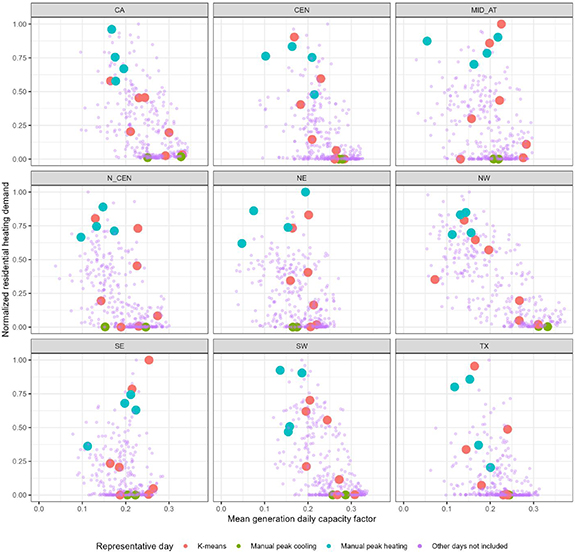
Figure 10. Daily solar capacity factor vs residential heating demand. Days in the top left of each subplot are particularly important to capture as they indicate days of high heating demand during days of lower solar production.
Download figure:
Standard image High-resolution imageA.6. GHG emission results
The modeling framework allows for residual unabated natural gas emissions from residential heating fuel where such emissions are not cost-effective to eliminate at the modeled carbon price. These 2050 residual emissions are shown in figure 11.
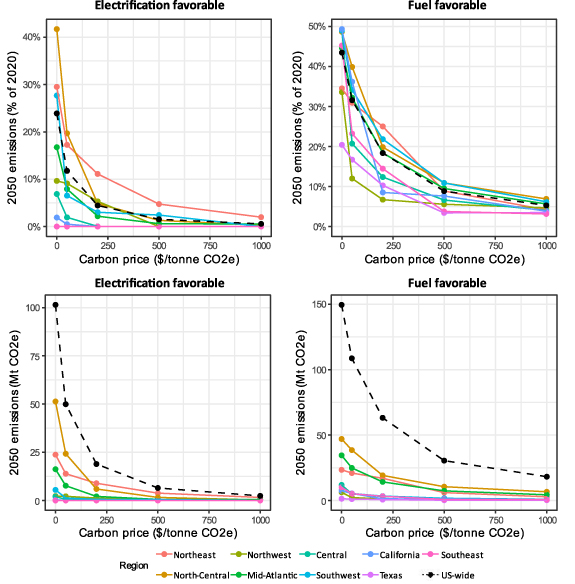
Figure 11. Residential heating fuel emissions in 2050 shown as a percentage of 2020 emissions (top) and in Mt CO2e (bottom) from both the electrification-favorable (left) and fuel-favorable (right) scenarios. Modeled carbon prices are $0, $50, $200, $500, and $1000 per tonne CO2e. Note the differing y-axis scales.
Download figure:
Standard image High-resolution imageA.7. Detailed hybrid capacity results
In the hybrid heat pump, the optimization model will deploy either the gas heater or heat pump components as necessary to achieve the lowest cost. The hourly deployment of gas and electricity to meet heating loads in each region for each hour in each representative day are shown in figure 12 (electrification-favorable scenario) and figure 13 (fuel-favorable scenario).
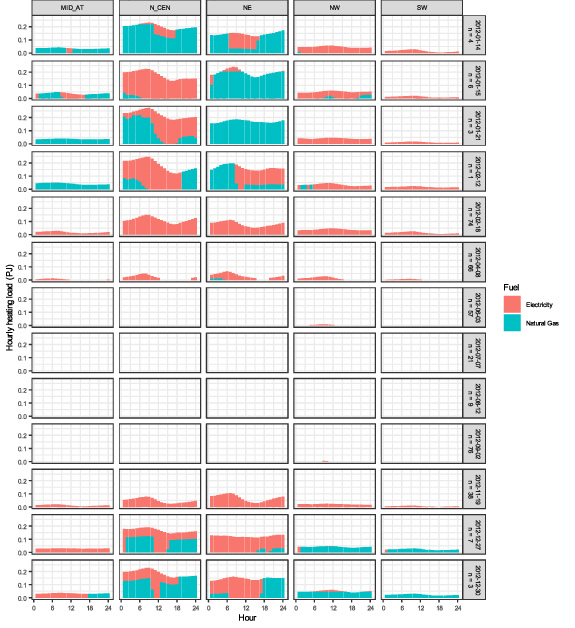
Figure 12. Hourly hybrid heat pump load by fuel type, for 2050 in electrification-favorable scenario with a carbon price of $200 per tonne CO2e. The y-axis represents heating loads met, not fuel energy content.
Download figure:
Standard image High-resolution image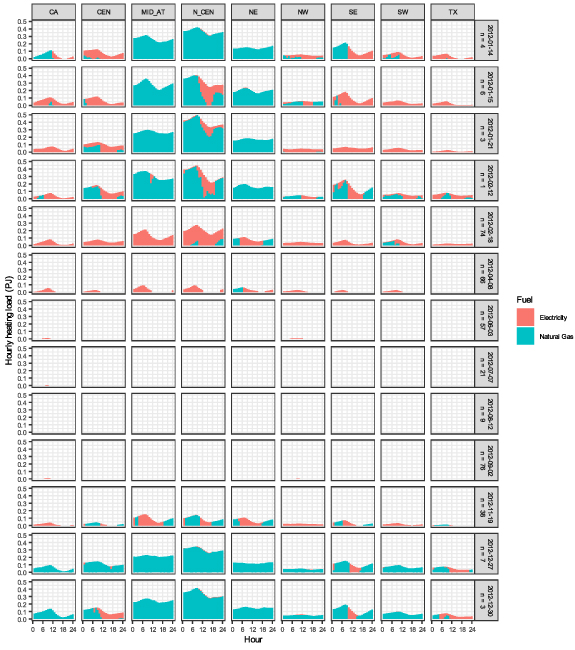
Figure 13. Hourly hybrid heat pump load by fuel type, for 2050 in fuel-favorable scenario with a carbon price of $200 per tonne CO2e. The y-axis represents heating loads met, not fuel energy content.
Download figure:
Standard image High-resolution imageA.8. Detailed electric capacity results
The changes in electric capacity by region are shown in figure 14 (electrification-favorable scenario) and figure 15 (fuel-favorable scenario).
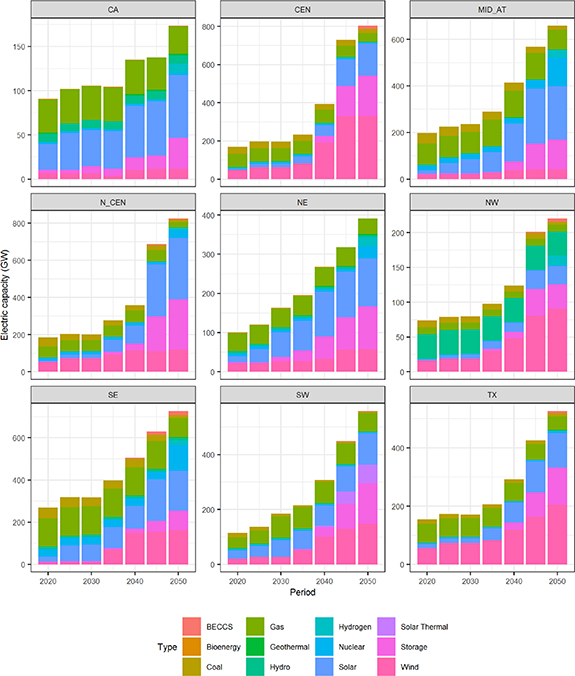
Figure 14. Electric capacity installation type by region for electrification-favorable scenario.
Download figure:
Standard image High-resolution image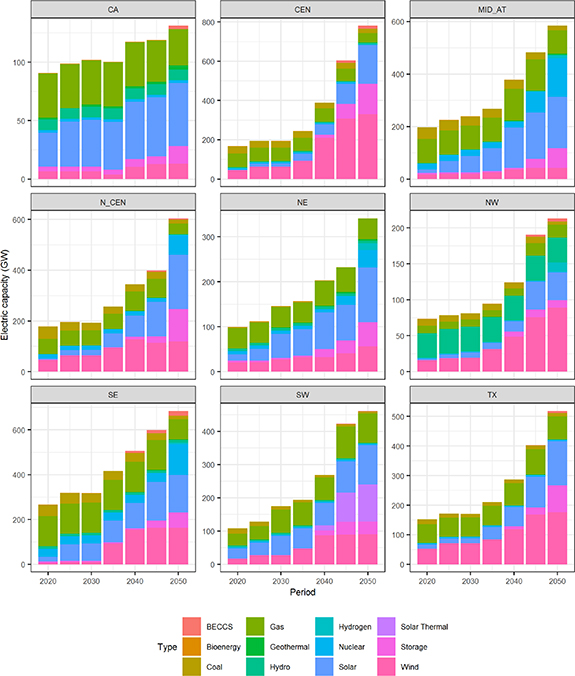
Figure 15. Electric capacity installation type by region for fuel-favorable scenario.
Download figure:
Standard image High-resolution imageA.9. Hybrid operating costs
Current retail rate design does not provide financial incentives to operate heat pumps at anything below modest temperatures, driven in part by inefficient retail rate design where the volumetric rate exceeds short run marginal costs of generating electricity. This will need to be addressed whether pursuing an all-electric or hybrid pathway.
For example, the 2023 US-wide average residential retail electricity rate is 15.98 cents per kWh and the average residential gas rate is $15.23 per Mcf [84, 85]. Converting to comparable units using a gas energy density of 1.038 MMBtu per Mcf, the gas residential retail rate is 5.01 cents per kWh. At these rates, a heat pump would need to be operating at a COP above 3.2 for it to be financially preferable from a household perspective considering operating costs alone. The temperature at which this occurs will vary significantly by heat pump model, but is relatively high. For example, for a HSPF 11 Carrier Greenspeed 3 ton heat pump, this occurs at an approximate temperature of 33 F (estimated by linear interpolation between a COP of 3.8 at 47 F and 2.54 at 17 F) [86]. While these national average rates and one heat pump model do not represent all scenarios, they are indicative of a larger problem facing residential building heat electrification of either an all-electric or hybrid variety. To lower household costs associated with electrification (all-electric or hybrid), volumetric retail rates will need to be reduced to incentivize households to use heat pumps.
Footnotes
- 7
Heat pump COP is the ratio of heat delivered to electricity input. Heat pumps use electricity to transfer heat, leading to COPs greater than 1, where electric resistance heat converts electric energy to heat energy, and can therefore never have a COP greater than 1 (i.e. 100% efficiency).


