


Abstract
Core-collapse supernova (SN) explosions expose the structure and environment of massive stars at the moment of their death. We use the global fitting technique of Pejcha & Prieto to estimate a set of physical parameters of 19 normal SNe II, such as their distance moduli, reddenings, 56Ni masses  , and explosion energies
 from multicolor light curves and photospheric velocity curves. We confirm and characterize known correlations between
 and bolometric luminosity at 50 days after the explosion, and between
 and
 . We pay special attention to the observed distribution of
 coming from a joint sample of 38 SNe II, which can be described as a skewed-Gaussian-like distribution between
 and
 , with a median of
 , mean of
 , standard deviation of
 , and skewness of 3.050. We use a two-sample Kolmogorov–Smirnov test and two-sample Anderson–Darling test to compare the observed distribution of
 to results from theoretical hydrodynamical codes of core-collapse explosions with the neutrino mechanism presented in the literature. Our results show that the theoretical distributions obtained from the codes tested in this work, KEPLER and Prometheus Hot Bubble, are compatible with the observations irrespective of different pre-SN calibrations and different maximum mass of the progenitors.
1. Introduction
Most massive stars with initial mass  finish their lives with a collapse of their iron cores (e.g., Kalirai et al. 2008; Smartt 2009; Smartt et al. 2009; Ibeling & Heger 2013; but see also Zapartas et al. 2017 for the contribution of lower-mass stars in binary stars). A small fraction of the
 erg of gravitational potential energy released in the collapse can power a core-collapse supernova (CCSN) explosion, leaving behind a neutron star or a black hole. A non-negligible fraction of massive stars might fail to explode as CCSNe and instead relatively quietly collapse to a black hole (e.g., Nadezhin 1980; Burrows 1986; Liebendörfer et al. 2001; Heger et al. 2003; Kochanek et al. 2008; O’Connor & Ott 2011; Lovegrove & Woosley 2013; Kochanek 2014; Adams et al. 2017; although see also Kushnir & Katz 2015 for an alternative explosion model).
The most common kind of CCSNe are Type II supernovae (SNe II) with broad spectral lines of hydrogen and plateau (SN II-P) light curves (e.g., Smith et al. 2011; Graur et al. 2017). The success of amateur and professional SN surveys (e.g., Calán/Tololo, Hamuy et al. 1993; Lick Observatory Supernova Search (LOSS), Li et al. 2011; CHASE, Pignata et al. 2009; PTF/iPTF, Rau et al. 2009; Pan-Starrs, Kaiser et al. 2002; ASAS-SN, Shappee et al. 2014) has been paramount for follow-up studies that have uncovered the full range of observed and physical properties of normal SNe II, as well as significant correlations between some of their properties (e.g., Hamuy 2003; Arcavi et al. 2012; Anderson et al. 2014; Faran et al. 2014; Gutiérrez et al. 2014; Pejcha & Prieto 2015a, 2015b; Sanders et al. 2015; Holoien et al. 2016; Rubin et al. 2016; Valenti et al. 2016). Hydrodynamical models of explosions of hydrogen-rich massive stars explain relatively well most of the main features of the light curves and spectra of normal SNe II (e.g., Kasen & Woosley 2009; Bersten et al. 2011; Dessart & Hillier 2011; Pumo & Zampieri 2011; Morozova et al. 2015; Lisakov et al. 2017).
Some of the CCSN discoveries in nearby galaxies and the availability of deep pre-explosion images from HST and ground-based 8 m class telescopes have led to the detection of a number of massive star progenitors, most of them red supergiants (RSGs; e.g., Smartt 2009, 2015). A confrontation of these detections and upper limits with the expectations from a normal Salpeter stellar initial mass function (IMF; Salpeter 1955) constrains the main-sequence progenitor masses of normal SNe II to be  (e.g., Smartt 2015). The relatively low upper limit in progenitor masses, compared to the local samples of RSGs (e.g., Neugent et al. 2012; Massey & Evans 2016), can be interpreted as evidence for failed explosions and black hole formation above this mass. However, there remain other possible explanations, and we need to seek a consistent picture encompassing not only the still limited set of progenitor detections but also other constraints.
A substantial effort has been undertaken to understand the CCSN explosion mechanism with numerical simulations (e.g., Janka 2012; Bruenn et al. 2013; Burrows 2013; Couch 2013; Ott 2016, and references therein), but the ultimate goal has not been reached yet, in part due to many complexities of the physics involved (e.g., Burrows 2016; Janka et al. 2016). As a result, the community has been developing parameterized 1D explosion models that capture some of the most important aspects of the neutrino mechanism physics. Application of these models to a wide range of progenitors has revealed that successful and failed explosions depend critically on the internal structure of the progenitors (e.g., O’Connor & Ott 2011; Ugliano et al. 2012; Pejcha & Thompson 2015; Sukhbold et al. 2016), producing a more complicated picture than the traditional single progenitor mass cut for failed explosions and black hole formation (e.g., Heger et al. 2003). These studies have also predicted the distributions of physical parameters of the SN explosions, such as the asymptotic kinetic energies and masses of 56Ni synthesized in the explosions, which can lead to observational tests of the massive star progenitors and the explosion mechanism with complete samples of CCSNe.
In this paper, we study the physical parameters of a sample of well-observed, normal SNe II, following the analysis by Pejcha & Prieto (2015a, 2015b). We mainly focus on the observed 56Ni mass distribution and compare it with recent results from SN explosion models. In Section 2, we present the data of the SNe II used in this work. In Section 3, we briefly discuss the code used to fit the multicolor light curves and expansion velocity curves. In Section 4, we show the fits obtained from the code and the physical parameters. In Section 5, we discuss the completeness of our joint sample and focus on the nickel mass distribution. In Section 6, we compare theoretical nickel mass distributions with our observed distribution, where we found that the KEPLER and Prometheus Hot Bubble codes seem to match the observations.
2. Data
We studied a subsample of 11 normal SNe II from the Calan-Tolo Supernova Program (C&T; Hamuy et al. 1993) and Carnegie Type II Supernova Survey (CATS; Galbany et al. 2016), with sufficient photometry in the optical UBVRI bands up to the nebular phase (Galbany et al. 2016) and spectra obtained at multiple epochs in the optical wavelength range (C. Gutiérrez et al. 2017a, 2017b, in preparation). We obtained expansion velocities from the SNe at different epochs by measuring the position of the minimum of the P Cygni absorption trough of the Fe ii line at rest wavelength of 5169 Å, which is a good tracer of the photosphere (Takáts & Vinkó 2012). The photometric measurements for SN 2003hn were supplemented with measurements from Krisciunas et al. (2009).
We added eight more well-observed, normal SNe II with data published in the literature: SN 2009ib (Takáts et al. 2015), SN 2012ec (Barbarino et al. 2015), SN 2013ab (Bose et al. 2015), SN 2013ej (Dhungana et al. 2016; Huang et al. 2015), SN 2013fs (Smartt et al. 2015; Childress et al. 2016; Valenti et al. 2016; Yaron et al. 2017), SN 2014G (Terreran et al. 2016), ASASSN-14gm/SN 2014cx (Valenti et al. 2016; J. L. Prieto et al. 2017, in preparation), and ASASSN-14 ha (Childress et al. 2016; Valenti et al. 2016). Our final sample consists of 19 SNe II. The SNe with their references for the data used in this paper are presented in Table 1.
Table 1. Supernovae and References
| Supernova | References |
|---|---|
| SN 1992ba | Galbany et al. (2016), C. Gutiérrez et al. (2017a, 2017b, in preparation) |
| SN 2002gw | Galbany et al. (2016), C. Gutiérrez et al. (2017a, 2017b, in preparation) |
| SN 2003B | Galbany et al. (2016), C. Gutiérrez et al. (2017a, 2017b, in preparation) |
| SN 2003bn | Galbany et al. (2016), C. Gutiérrez et al. (2017a, 2017b, in preparation) |
| SN 2003E | Galbany et al. (2016), C. Gutiérrez et al. (2017a, 2017b, in preparation) |
| SN 2003ef | Galbany et al. (2016), C. Gutiérrez et al. (2017a, 2017b, in preparation) |
| SN 2003fb | Galbany et al. (2016), C. Gutiérrez et al. (2017a, 2017b, in preparation) |
| SN 2003hd | Galbany et al. (2016), C. Gutiérrez et al. (2017a, 2017b, in preparation) |
| SN 2003hn | Galbany et al. (2016), C. Gutiérrez et al. (2017a, 2017b, in preparation) |
| SN 2003ho | Galbany et al. (2016), C. Gutiérrez et al. (2017a, 2017b, in preparation) |
| SN 2003T | Galbany et al. (2016), C. Gutiérrez et al. (2017a, 2017b, in preparation) |
| SN 2009ib | Takáts et al. (2015) |
| SN 2012ec | Barbarino et al. (2015) |
| SN 2013ab | Bose et al. (2015) |
| SN 2013ej | Dhungana et al. (2016), Huang et al. (2015) |
| SN 2013fs | Childress et al. (2016), Smartt et al. (2015), |
| Valenti et al. (2016), Yaron et al. (2017) | |
| SN 2014G | Terreran et al. (2016) |
| ASASSN-14gm | J. L. Prieto et al. (2017, in preparation); Valenti et al. (2016) |
| ASASSN-14 ha | Childress et al. (2016), Valenti et al. (2016) |
Download table as: ASCIITypeset image
3. Model
In order to analyze the data and derive physical parameters for the SNe II, we used the model of Pejcha & Prieto (2015a, 2015b), which simultaneously fits a phenomenological model to multicolor light curves in bands ranging from the near-UV to the near-IR and photospheric expansion velocities at different epochs. The model is based on the expanding photosphere method (e.g., Kirshner & Kwan 1974; Eastman et al. 1996), a generalization of the Baade–Wesselink technique (Pejcha & Kochanek 2012). Global fitting of all observations removes manual procedures such as correction for reddening and construction of  and replaces them with functions that are consistently and mechanically applied to all objects. The observational uncertainties can thus be propagated through these functions, revealing covariances between quantities of interest.
The global part of the model is an empirical description of the evolution of the SN spectral energy distribution (SED), which is separated in achromatic changes of photospheric radius constrained by the expansion velocities and chromatic changes in the SED arising from the temperature evolution constrained by photometry. Pejcha & Prieto (2015a) showed that such a uniquely defined sequence exists by fitting 26 nearby SNe with data in 21 photometric bands. The solution was anchored to a couple of well-studied objects. The SED evolutionary sequence allows us to utilize information from all objects in the sample, for example, by “predicting” the light curve in a band without actual observations and using this prediction to estimate  .
Each SN is described by up to 12 parameters, such as the distance modulus μ of the host galaxy, the total color excess parameterized with  , the time of the explosion, the plateau duration, the transition width, and parameters specifying the phenomenological description of light curves and expansion velocities, in particular the starting point and the pace through the SED evolutionary sequence. Pejcha & Prieto (2015a) argued that these parameters are sufficient to describe the observed diversity of Type II-P light curves.
The model fitting parameters are manipulated to provide the bolometric luminosity  at each epoch after explosion, the ejected 56Ni mass
 from the luminosity in the radioactive decay tail, and the explosion energy
 , mass of the ejected hydrogen envelope
 , and progenitor radius R based on analytic scaling relations from Litvinova & Nadezhin (1985) and Popov (1993) (see Pejcha & Prieto 2015b, for a summary of these scaling relations). The bolometric luminosity is obtained from integrating the SED of the model in a given epoch between 0.19 μm (W2 band in Swift/UVOT) and 2.2 μm (K band), including an extrapolation to longer wavelengths using a Rayleigh–Jeans tail of the blackbody. To constrain
 from the radioactive decay tail, we assume full gamma-ray trapping.
In this work, we use the global parameters and the covariance matrix of the model constrained in Pejcha & Prieto (2015a). The other input parameters for the code to fit each SN are the magnitudes in different filters, the photospheric expansion velocities, and the explosion epochs  with their respective uncertainties used as constraints for the fits (in some cases). These were taken from Table 4 of Anderson et al. (2014) for four out of six SNe II in common with their sample (we left t0 as a free parameter for SN 2002gw and SN 2003E to get better fits), using the values with smaller uncertainties between spectral matching and explosion nondetection. For the last eight SNe in Table 1,
 was taken from their respective references. In some cases
 was fixed in order to constrain the fits. For some SNe, the transition time
 and one of the parameters describing the slope of the radioactive exponential decay,
 , were also fixed in order to constrain the fits (see the note in Table 2).
Table 2. Table of Fit Parameters
| Supernova |

|
 (day) |
 (day) |

|
log( ) |
log( ) |
|---|---|---|---|---|---|---|
| SN 1992ba | 48884.2 ± 3.5 | 130.3 ± 3.5 | 4.0 ± 0.7 | 0.175 ± 0.013 | −1.43 ± 0.17 | 8.39 ± 0.17 |
| SN 2002gw | 52551.6 ± 3.2 | 125.6 ± 6.4 | 3.4 ± 4.4 | 0.113 ± 0.018 | −1.36 ± 0.12 | 8.43 ± 0.11 |
| SN 2003B | 52610.5 ± 7.7 | 108.2 ± 13.3 | 1.4 ± 6.0 | 0.025 ± 0.019 | −1.64 ± 0.24 | 8.26 ± 0.23 |
| SN 2003bn | 52695.6 ± 1.9 | 119.2 ± 2.1 | 4.9 ± 0.7 | 0.114 ± 0.012 | −1.51 ± 0.09 | 8.36 ± 0.08 |
| SN 2003E | 52628.0 ± 3.4 | 123.6 ± 5.4 | 2.2 ± 1.3 | 0.248 ± 0.024 | −1.08 ± 0.36 | 8.44 ± 0.11 |
| SN 2003ef | 52743.7 ± 5.5 | 121.9 ± 6.1 | 1.0 ± 3.3 | 0.360 ± 0.013 | −1.04 ± 0.14 | 8.67 ± 0.11 |
| SN 2003fb | 52777.3 ± 5.2 | 94.4 ± 5.1 | 3.6 ± 0.6 | 0.584 ± 0.016 | −1.31 ± 0.16 | 8.38 ± 0.14 |
| SN 2003hd | 52854.7 ± 2.3 | 100.9 ± 3.0 | 2.7 ± 1.7 | 0.153 ± 0.013 | −1.52 ± 0.08 | 8.44 ± 0.08 |
| SN 2003hn | 52870.2 ± 1.1 | 90.5 ± 1.1 | 3.7 ± 0.2 | 0.273 ± 0.006 | −1.74 ± 0.09 | 8.28 ± 0.09 |
| SN 2003ho |

|
80.2 ± 1.3 | 4.8 ± 4.6 | 0.753 ± 0.016 | −1.88 ± 0.10 | 8.10 ± 0.07 |
| SN 2003T |

|
104.1 ± 0.9 | 3.1 ± 0.4 | 0.239 ± 0.013 | −1.53 ± 0.08 | 8.32 ± 0.06 |
| SN 2009ib |

|

|

|
0.179 ± 0.006 | −1.12 ± 0.07 | 8.28 ± 0.06 |
| SN 2012ec |

|
103.4 ± 2.2 |

|
0.093 ± 0.009 | −1.54 ± 0.05 | 8.44 ± 0.04 |
| SN 2013ab | 56342.4 ± 1.1 | 97.2 ± 1.0 | 4.7 ± 0.5 | 0.600 ± 0.019 | −1.20 ± 0.13 | 8.67 ± 0.14 |
| SN 2013ej |

|
100.7 ± 0.3 | 1.9 ± 0.2 | 0.163 ± 0.009 | −2.06 ± 0.09 | 8.29 ± 0.08 |
| SN 2013fs |

|
75.5 ± 0.8 | 7.7 ± 0.6 | 0.134 ± 0.010 | −1.07 ± 0.08 | 8.58 ± 0.06 |
| SN 2014G |

|
48.8 ± 2.2 | 19.6 ± 0.7 | 0.208 ± 0.021 | −1.46 ± 0.06 | 8.64 ± 0.07 |
| ASSASSN-14gm | 56901.4 ± 0.4 | 106.7 ± 1.0 | 6.6 ± 0.6 | 0.018 ± 0.010 | −1.12 ± 0.09 | 8.56 ± 0.08 |
| ASSASSN-14 ha |

|

|
1.3 ± 0.1 | 0.006 ± 0.007 | −2.09 ± 0.11 | 8.10 ± 0.11 |
Note. Values with an asterisk were fixed.
Download table as: ASCIITypeset image
4. Results
4.1. Fitting Results
In Figure 1 we show the resulting fits to the light curves and expansion velocity curve for SN 2002gw. The entire sample of SNe II with their respective fits is shown in the Appendix in Figures 7, 8, 9 and 10. Fitting parameters for individual SNe II are given in Tables 2 and 3. We show explosion times (t0 in days), plateau durations ( in days), plateau transition widths (
 in days), total reddenings (
 in mag), ejected nickel masses (
 in M⊙), bolometric luminosities at 50 days after the explosion (
 in L⊙), distance moduli (μ in mag), expansion velocity power-law exponents (
 ),
 , and the number of data points used for each fit (n). The code has 12 free parameters, so the total number of degrees of freedom is
 . The final fits and uncertainties in the parameters are obtained after renormalizing the magnitude and photospheric velocity errors to have
 . This is only a crude fix, assuming that the underlying model is an accurate description of the observations.
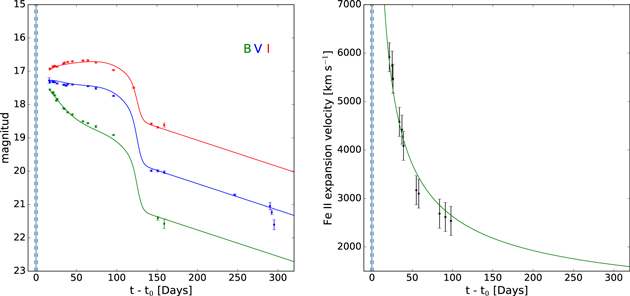
Figure 1. Multiband light curves and photospheric expansion velocity curves along with their best-fit models for SN 2002gw. The left panel shows the light curves in the optical bands, while the right panel shows the expansion velocity curve. The vertical solid blue line represents the explosion time t0 derived from the fits with its uncertainties (vertical dashed blue lines). The complete sample is shown in the Appendix in Figures 7, 8, 9 and 10.
Download figure:
Standard image High-resolution imageTable 3. Table of Fit Parameters (Continuation)
| Supernova | μ |

|

|
n |
|---|---|---|---|---|
| SN 1992ba | 31.36 ± 0.39 | −0.63 ± 0.09 | 297.3 | 52 |
| SN 2002gw | 33.54 ± 0.26 | −0.62 ± 0.09 | 367.9 | 69 |
| SN 2003B | 31.91 ± 0.52 | −0.66 ± 0.11 | 785.6 | 85 |
| SN 2003bn | 33.42 ± 0.18 | −0.82 ± 0.07 | 198.6 | 69 |
| SN 2003E | 34.09 ± 0.29 | −0.84 ± 0.07 | 286.6 | 56 |
| SN 2003ef | 33.66 ± 0.26 | −0.50 ± 0.09 | 90.7 | 43 |
| SN 2003fb | 34.05 ± 0.36 | −0.71 ± 0.08 | 124.1 | 47 |
| SN 2003hd | 35.34 ± 0.17 | −0.62 ± 0.07 | 86.8 | 60 |
| SN 2003hn | 30.37 ± 0.21 | −0.75 ± 0.01 | 2539.7 | 269 |
| SN 2003ho | 32.35 ± 0.17 | −0.60 ± 0.09 | 85.7 | 40 |
| SN 2003T | 34.69 ± 0.16 | −0.74 ± 0.04 | 99.0 | 50 |
| SN 2009ib | 31.72 ± 0.15 | −1.00 ± 0.02 | 2420.8 | 347 |
| SN 2012ec | 31.36 ± 0.09 | −0.77 ± 0.03 | 3404.8 | 294 |
| SN 2013ab | 31.33 ± 0.31 | −0.38 ± 0.03 | 6311.0 | 287 |
| SN 2013ej | 28.96 ± 0.20 | −0.68 ± 0.01 | 8518.7 | 559 |
| SN 2013fs | 33.26 ± 0.13 | −0.83 ± 0.01 | 7158.7 | 411 |
| SN 2014G | 31.81 ± 0.15 | −0.70 ± 0.02 | 16429.4 | 404 |
| ASSASSN-14gm | 31.78 ± 0.20 | −0.70 ± 0.03 | 4978.8 | 620 |
| ASSASSN-14 ha | 30.83 ± 0.26 | −0.84 ± 0.01 | 16480.8 | 917 |
Download table as: ASCIITypeset image
We expected the model to reproduce well the key features of these SNe II owing to previous results obtained in Pejcha & Prieto (2015a, 2015b), and this is indeed what we see in the results from our work also. There are a couple of interesting cases that are worth noting. SN 2014G is the fastest-declining SN II in our sample (see Bartunov & Blinnikov 1992; Moriya et al. 2016; Morozova et al. 2017, for possible explanations of fast-declining SNe II). The code fits relatively well the optical light curves of this SN, except in the late-time phase of the light curve, where few measurements indicate that the observed decay slope is faster than the model. This is because we are assuming full gamma-ray trapping, and SN 2014G shows evidence of non-negligible leakage of gamma rays (Terreran et al. 2016). However, the  estimate we obtain from our fit with full trapping is fairly consistent with the
 estimate of 0.045
 obtained by Terreran et al. (2016), which considers gamma-ray leakage.
Another interesting case is SN 2013fs, which was caught very close to the time of explosion, and the early spectra show clear signs of strong interaction between the SN ejecta and a dense circumstellar medium (CSM; e.g., Dessart et al. 2017; Yaron et al. 2017). In the first ∼10–20 days after explosion, the model fits underestimate the SN fluxes in some bands (see lower panel of Figure 9 in the Appendix). This is likely related to extra flux produced by the strong ejecta–CSM interaction observed early on in the evolution of the SN (e.g., Dessart et al. 2017). The poor fit of the early light curve indicate that the observed evolution was not compatible with the universal Type II-P SED evolutionary sequence described above. This potentially offers a way to diagnose similar events in the future data sets.
4.2. Physical Parameters
In Table 4 we present the explosion energies ( in erg), ejected hydrogen envelopes masses (
 in M⊙), and progenitor radii (R in R⊙) derived from the parameterized scaling relations in Litvinova & Nadezhin (1985) and Popov (1993). Both use a linear relation of the form

where b = (MV, log  , log v), MV is the absolute magnitude in the V band at 50 days,
 is the duration of the plateau phase, and v is the expanding velocity of the photosphere at 50 days in units of 1000 km s−1. Similar relations are used for
 and R, but using their respective values of α and η (see Litvinova & Nadezhin 1985; Popov 1993, for more details). It is worth noticing that the radii obtained with these scaling relations from the light-curve fits are on average smaller (
 ) compared to the values estimated from observed RSGs of SNe II (e.g., Levesque et al. 2005). Other works that have studied the radii of SN II progenitors from their very early light curves obtain similar results (e.g., González-Gaitán et al. 2015). The discrepancy is understandable, because at mid-plateau, where the quantities relevant for scaling relations are obtained, the SN photosphere has substantially retreated inward in the mass coordinate and the radius from the scaling relation thus does not represent the original surface of the star. Nonetheless, the radii of the progenitor estimated from the scaling relations do not affect the estimates of
 , which come from the radiative tail.
Table 4. Table of Results for Derived Parameters
| Litvinova & Nadezhin (1985) | Popov (1993) | |||||
|---|---|---|---|---|---|---|
| Supernova |

|

|

|

|

|

|
| SN 1992ba | 0.98 ± 0.18 | 1.40 ± 0.06 | 2.48 ± 0.06 | 0.91 ± 0.21 | 1.21 ± 0.08 | 2.73 ± 0.07 |
| SN 2002gw | 1.10 ± 0.10 | 1.44 ± 0.06 | 2.42 ± 0.05 | 1.08 ± 0.12 | 1.26 ± 0.08 | 2.64 ± 0.07 |
| SN 2003B | 0.78 ± 0.20 | 1.21 ± 0.11 | 2.43 ± 0.11 | 0.63 ± 0.23 | 0.96 ± 0.14 | 2.71 ± 0.14 |
| SN 2003bn | 1.03 ± 0.07 | 1.38 ± 0.03 | 2.38 ± 0.04 | 0.99 ± 0.09 | 1.20 ± 0.04 | 2.60 ± 0.06 |
| SN 2003E | 1.12 ± 0.11 | 1.43 ± 0.06 | 2.41 ± 0.06 | 1.09 ± 0.14 | 1.26 ± 0.07 | 2.64 ± 0.08 |
| SN 2003ef | 1.24 ± 0.09 | 1.42 ± 0.04 | 2.54 ± 0.07 | 1.19 ± 0.10 | 1.22 ± 0.05 | 2.81 ± 0.09 |
| SN 2003fb | 1.08 ± 0.12 | 1.26 ± 0.06 | 2.26 ± 0.08 | 1.03 ± 0.14 | 1.06 ± 0.07 | 2.48 ± 0.09 |
| SN 2003hd | 1.10 ± 0.07 | 1.29 ± 0.03 | 2.34 ± 0.05 | 1.05 ± 0.08 | 1.09 ± 0.05 | 2.57 ± 0.07 |
| SN 2003hn | 0.83 ± 0.10 | 1.10 ± 0.04 | 2.38 ± 0.03 | 0.66 ± 0.12 | 0.83 ± 0.05 | 2.67 ± 0.04 |
| SN 2003ho | 1.15 ± 0.08 | 1.30 ± 0.05 | 1.83 ± 0.05 | 1.26 ± 0.10 | 1.18 ± 0.06 | 1.90 ± 0.07 |
| SN 2003T | 1.00 ± 0.07 | 1.30 ± 0.03 | 2.30 ± 0.03 | 0.95 ± 0.09 | 1.10 ± 0.04 | 2.52 ± 0.04 |
| SN 2009ib | 0.83 ± 0.07 | 1.39 ± 0.02 | 2.52 ± 0.03 | 0.73 ± 0.08 | 1.20 ± 0.03 | 2.79 ± 0.04 |
| SN 2012ec | 1.01 ± 0.04 | 1.25 ± 0.04 | 2.43 ± 0.04 | 0.90 ± 0.06 | 1.02 ± 0.05 | 2.70 ± 0.06 |
| SN 2013ab | 1.16 ± 0.16 | 1.21 ± 0.06 | 2.56 ± 0.06 | 1.02 ± 0.20 | 0.94 ± 0.07 | 2.88 ± 0.08 |
| SN 2013ej | 1.00 ± 0.10 | 1.28 ± 0.03 | 2.26 ± 0.03 | 0.95 ± 0.12 | 1.09 ± 0.04 | 2.47 ± 0.04 |
| SN 2013fs | 0.97 ± 0.06 | 0.95 ± 0.03 | 2.58 ± 0.03 | 0.71 ± 0.08 | 0.59 ± 0.03 | 2.96 ± 0.04 |
| SN 2014G | 1.15 ± 0.05 | 0.69 ± 0.06 | 2.54 ± 0.07 | 0.83 ± 0.08 | 0.26 ± 0.09 | 2.95 ± 0.10 |
| ASASSN-14gm | 1.20 ± 0.09 | 1.34 ± 0.03 | 2.42 ± 0.03 | 1.15 ± 0.11 | 1.14 ± 0.04 | 2.67 ± 0.04 |
| ASASSN-14ha | 0.63 ± 0.13 | 1.33 ± 0.04 | 2.50 ± 0.03 | 0.49 ± 0.16 | 1.12 ± 0.06 | 2.78 ± 0.04 |
Download table as: ASCIITypeset image
For further analysis we combined our sample with the updated sample of Pejcha & Prieto (2015b), doubling the number of objects to a total of 38. Some of the main parameters for this joint sample have the following ranges:  =
 dex, with mean −1.52 dex and dispersion 0.41 dex;
 =
 dex, with mean 8.38 dex and dispersion 0.29 dex;
 =
 days, with mean 110.2 days and dispersion 20.9 days;
 =
 days, with mean 5.6 days and dispersion 5.9 days; and
 =
 , with mean −0.70 and dispersion 0.16.
In Figure 2 we show the estimates of  versus
 of this joint sample, with their 1σ confidence ellipsoids obtained from the covariances between these parameters calculated by the fitting code. We confirm the known correlation between
 and
 (e.g., Hamuy 2003; Spiro et al. 2014; Pejcha & Prieto 2015a, 2015b). We calculated the best linear fit taking into account the covariance matrix of each data point and the intrinsic width of the relation using the generating function of Hogg et al. (2010) and the MCMC sampler emcee (Foreman-Mackey et al. 2013). The best-fit relation is given in Figure 2. Our slope is compatible within the uncertainties with the results of Pejcha & Prieto (2015b). The intrinsic width of the relation is
 , which implies a scatter of 0.2 dex in
 for fixed
 .
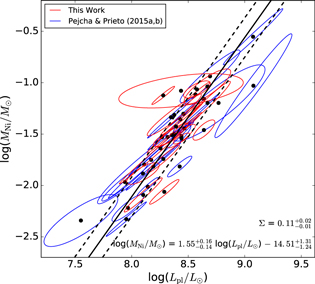
Figure 2. Correlation between the plateau luminosity at 50 days after the explosion,  , and the nickel mass,
 , for the joint sample (red; our sample; blue: the sample of Pejcha & Prieto 2015a, 2015b). We show the best linear fit and the intrinsic width of the relation with solid and dashed lines, respectively.
Download figure:
Standard image High-resolution imageThe relation between  and
 is shown in Figure 3 for the joint sample, with the 1σ confidence ellipsoids for each SN. In the left panel we show the results for the scaling relations in Litvinova & Nadezhin (1985), and in the right panel we show those for Popov (1993). We see that there are some differences between the two scaling relations, but the relative positions of the majority of the points are almost unchanged. The slopes and intrinsic widths are compatible within uncertainties with the results of Pejcha & Prieto (2015b). The intrinsic widths are large, especially for the scaling relation of Popov (1993), but we do not have a reason to trust one over the other.
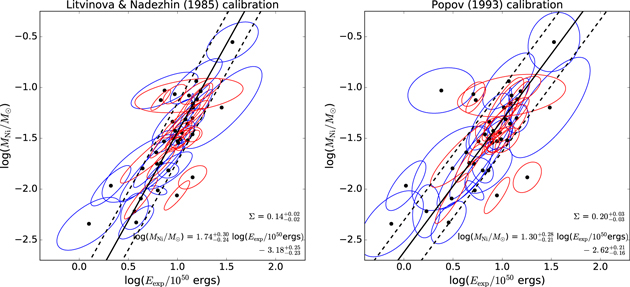
Figure 3. Nickel mass,  , as a function of explosion energy,
 , for the joint sample with the scaling relations of Litvinova & Nadezhin (1985; left panel) and Popov (1993; right panel). We can appreciate the correlation between
 and
 although it is not as evident as the one between
 and
 from Figure 2. We show the best linear fit and the intrinsic width for both scaling relations.
Download figure:
Standard image High-resolution imageWe can also see in Figure 3 that the observations show larger scatter in  than the theoretical models (see Figure 17 of Sukhbold et al. 2016), which could provide interesting constraints on the explosion mechanism that would be worth exploring by future models. The measured scatter might in part be caused by the scaling relations; however, a scatter of ∼1 dex for
 is hardly explained by uncertainties in them. In the case of the
 estimates from the scaling relations, the results could indeed be biased because the scalings do not take into account the contribution of the He core material, which in massive progenitors represents a substantial fraction of the ejecta mass. The employed scaling relations also do not include corrections to
 from
 (Kasen & Woosley 2009; Sukhbold et al. 2016). Further analysis in this direction is out of the scope of this work.
5. Analysis
5.1. Sample Completeness
Our joint sample is potentially biased, because the objects come from several different surveys and we selected objects based purely on good photometric multiwavelength coverage, including the radioactive decay phase, and availability of several epochs of optical spectroscopic data to derive photospheric expansion velocity. To assess the completeness of our joint SN II sample, we compare it to the volume-limited sample of Li et al. (2011) based on the LOSS. The LOSS sample should be more complete, with all the discoveries coming from the same survey.
In order to compare the two samples, we used the peak absolute R-band magnitudes of SNe II (II-P and II-L) reported in Li et al. (2011). However, the reported peak absolute magnitudes in that study were not corrected for internal extinction in their host galaxies, so we used the average extinction from our joint sample (AR = 0.44 mag) as an approximate extinction correction for the LOSS SN II sample. Also, some of their low-luminosity SNe II seemed to be caused by an above average host extinction due to their position in their host galaxies, and we took them out of the sample. After these corrections, the lowest-luminosity objects in the Li et al. (2011) sample are SN 1999br (Pastorello et al. 2004) and SN 2003Z (Spiro et al. 2014). In our joint sample, the lowest-luminosity SN II is SN 2001dc (Pastorello et al. 2004). Comparing both samples, we found a slight deficit of low-luminosity SNe II in our joint sample, but overall the distributions of peak absolute magnitudes are fairly consistent. The minimum, maximum, and average peak absolute magnitudes for our joint sample are  , −14.7 and −16.9 mag, respectively. For the sample of Li et al. (2011), these values are
 , −13.9, and −16.8, respectively.
5.2.
 Distribution: Observations versus Theory

The iron peak isotope 56Ni is synthesized in the SN explosion within the inner few times 103 km of the progenitor, making it a sensitive probe of the explosion and other uncertain physics (e.g., Pejcha & Thompson 2015). Therefore, we are interested in comparing the distributions of  from the observational (joint) sample with theoretical results from CCSN explosion models. Our distribution of
 can be described as a skewed-Gaussian-like distribution between
 and
 , with a median of
 , mean of
 , standard deviation of
 , and skewness of 3.050.
We use the recent results by Sukhbold et al. (2016) on parameterized CCSN explosion models from the neutrino mechanism as a basis for comparison with observations. This study is particularly well suited for comparing with the observations because they present a grid of explosion models starting from 200 progenitor masses in the range  . The set of parameters for the different models are calibrated on the observed properties of SN 1987A for progenitors with
 and SN 1054 (the Crab) for progenitors with
 .
These progenitors were exploded with two different hydrodynamic codes, Prometheus Hot Bubble (P-HOTB; Janka & Mueller 1996; Kifonidis et al. 2003) and KEPLER (Weaver et al. 1978), with their physics fully discussed in the literature (e.g., Woosley et al. 2002; Woosley & Heger 2007, 2015; Sukhbold & Woosley 2014). The P-HOTB code includes the neutrino and high-density physics to follow iron-core collapse, neutrino energy, and lepton-number transport, while the KEPLER code does not include neutrino transport but is capable of calculating detailed nucleosynthesis and light curves.
The explosions were produced by (1) using KEPLER to calculate the evolution of a zero-age main-sequence star until pre-SN and then exporting results to P-HOTB; (2) using P-HOTB to calculate the collapse and neutrino transport, providing a range of plausible  export results back to KEPLER; and (3) using KEPLER to calculate the nucleosynthesis and light curves, adjusting certain parameters to give
 roughly in the middle of the range predicted by P-HOTB. This procedure resulted in a range of possible
 , within which the expected true value should be given by P-HOTB and a single value within that range for KEPLER (see Section 3.2 in Sukhbold et al. 2016, for more details), for each progenitor. Due to the employed procedure,
 from KEPLER and P-HOTB are not independent. We took this data set from the online model database associated with this paper.6
In order to construct a theoretical distribution of  , we started by assuming a Salpeter IMF with
 for the massive star progenitors, a reasonable assumption in this mass range (Bastian et al. 2010). Then, we randomly selected 100,000 progenitor masses from a Salpeter IMF between
 and
 , where
 was kept fixed at
 (given by the minimum progenitor mass studied in Sukhbold et al. 2016) and
 was initially set at
 to be consistent with the constraints from SN II progenitors (e.g., Smartt 2015).
For each progenitor with a successful explosion ( ), for which we assigned the nearest neighbor for masses between two values of their grid, we assigned two values of
 . One of the
 values was obtained from KEPLER-tabulated results, and the other was obtained using a random uniform distribution within the range of
 given by P-HOTB (see Figure 12 from Sukhbold et al. 2016). We also tried a linear interpolation. In this case, for progenitor masses between two values within the grid, we assign
 values by using a linear interpolation between the
 values associated with the progenitor masses in the grid. Using the interpolation resulted in similar distributions, so we do not show these results in this work. We used the Z9.6 progenitor model calibration (Crab-like) for
 , together with N20 and W18 progenitor model calibrations (SN 1987A-like) for
 , because they characterize best the progenitor of SN 1987A according to Sukhbold et al. (2016). It is worth noting that the W18 model calibration produces a slightly higher fraction of failed explosions than N20 (Figure 13 of their work).
In the top panels of Figure 4 we show the comparison of  distributions between the observational sample and the theoretical distributions obtained from the KEPLER (left) and P-HOTB (right) codes for the N20 model calibration. In the bottom panels of Figure 4 we show the cumulative distributions. The same plots are shown for W18 in Figure 5. The cumulative distributions coming from P-HOTB seem smoother given that we assigned a random uniformly distributed (within a range) value for each progenitor mass, as we explained above.
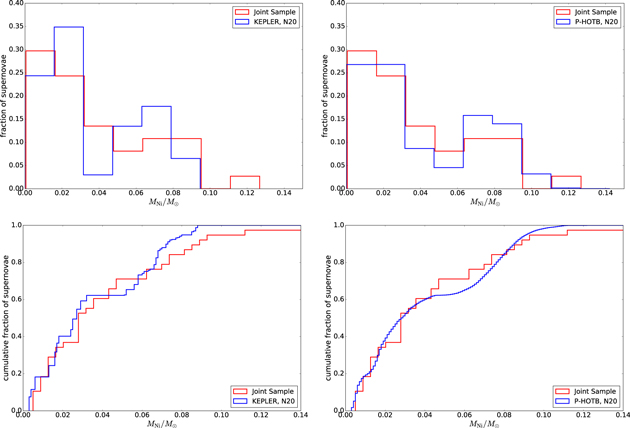
Figure 4. Comparison of the observed distribution of nickel mass  of our SN II sample with the theoretical distribution obtained from CCSN explosion models of Sukhbold et al. (2016). The theoretical distributions were calculated for two different hydrodynamical codes: KEPLER (left panels) and P-HOTB (right panels), for progenitors following a Salpeter IMF with
 M⊙ and
 M⊙. In the top panels, we show the comparison of
 distributions for the KEPLER code (with a small offset for visualization purposes) and the P-HOTB code with the joint sample. In the bottom panels, we show the same, but for the cumulative distributions. We used the N20 calibration for progenitors with
 and the only calibration available for progenitors with
 , Z9.6. The nickel yield from SN 1992H of
 is not included.
Download figure:
Standard image High-resolution image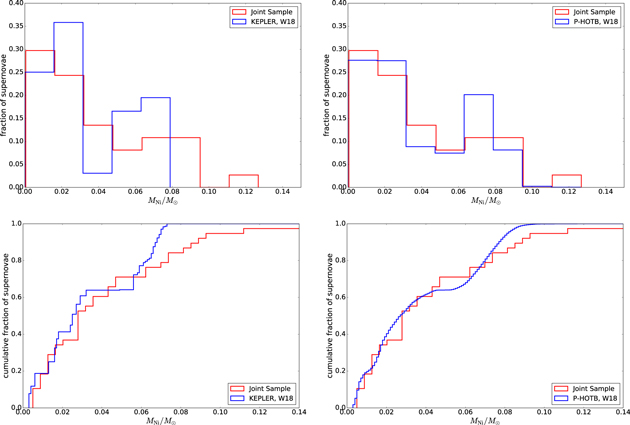
Figure 5. Same as in Figure 4, but for the W18 calibration presented in Sukhbold et al. (2016). We see that in this case the theoretical distributions show lower  values compared with the distributions obtained with the N20 calibration.
Download figure:
Standard image High-resolution imageIn this part of the analysis we did not include the nickel yield of SN 1992H from Pejcha & Prieto (2015a, 2015b), due to its value of  , which is significantly higher than that of all the other SNe II in our sample. However, it follows the correlation shown in Figure 2 and is consistent with the range of values found in previous studies (Hamuy 2003; Spiro et al. 2014). It is worth noting that Schmidt et al. (1994) and Clocchiatti et al. (1996) have calculated the distance to the host galaxy of SN 1992H, GC 5377, obtaining values of ∼30 and ∼20 Mpc (compared to ∼40 Mpc with our method), respectively. These values give lower
 than ours for the same reddening,
 and
 , respectively. Nonetheless, the method used in this work is self-consistent.
6. Discussion and Conclusions
We identify at least two different populations in the theoretical  explosion model distributions for the two hydrodynamic codes presented in Sukhbold et al. (2016). We clearly see a small gap around
 for the different models (see Figures 4 and 5). This is caused by the change in progenitor structure around
 (see Figure 5 of Sukhbold et al. 2016). Some parameters for the Crab-like progenitors are interpolated between the Crab model and the SN 1987A-like progenitors (see Section 3.1.3 in Sukhbold et al. 2016).
The  distributions obtained from both codes and model calibrations (N20 and W18) seem to follow the trend of the observed distribution at different
 ranges. We also notice that the theoretical
 values have a maximum yield of
 , but the observations show some luminous SNe II that produce
 (e.g., SN 1992H in this study; see also the sample of Hamuy 2003), much lower than typically high
 yields of
 of SNe Ib and Ic (e.g., Drout et al. 2011; Prentice et al. 2016). Further theoretical work is needed to be able to explain the highest
 values seen in observations of normal SNe II.
In addition, we compared the cumulative distributions of  obtained from the P-HOTB and KEPLER codes, for both model calibrations (N20 and W18), with the observations. We performed two-sample Kolmogorov–Smirnov (K-S) tests (Chakravarty et al. 1967) and two-sample Anderson–Darling (A–D) tests (Stephens 1974). The K-S test lets us compare two samples and tells us if they could have been drawn from the same distribution, where a p-value is used to quantify this. The A–D test is a modified version of the K-S test that gives more weight to the tails of the distributions than the K-S test does. The p-value gives us the probability of obtaining a result equal to or more extreme than what we observe here. If this value is below a certain threshold, called the significance level (
 ), we can discard our null hypothesis that both distributions, the observed and the theoretical one, come from the same distribution. We have set the value of
 to 0.01 (Wasserstein & Lazar 2016).
For the analysis we performed several two-sample K-S and A–D tests for distributions coming from IMFs with different upper-mass thresholds,  , ranging from 15 to
 (most of the progenitors above
 fail to explode or explode after losing their hydrogen envelopes, i.e., not as SNe II). These results are shown in Figure 6. For most of the cases we see that the p-values are well above
 , and we cannot exclude that observations and theory are drawn from the same distribution for nearly all choices of
 . The only exception is when we use the A–D test with the W18 calibration and KEPLER. This could be caused by the absence of high
 values for this calibration and the higher weight that the A–D test puts on the tails of the distribution. However, we think that this is not enough evidence to reject KEPLER model results.
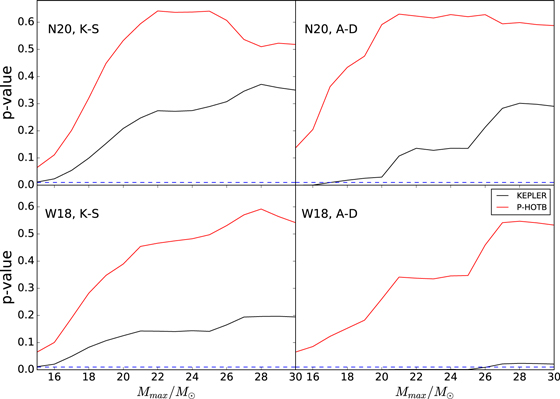
Figure 6. p-values of the two-sample K-S tests (left panels) and A–D tests (right panels) between our joint sample and the different theoretical distributions coming from IMFs with different Mmax. The N20 calibration is shown in the top panels, and the W18 calibration is shown in the bottom panels. The p-values from KEPLER and P-HOTB distributions are shown as a solid black line and red line, respectively. The dashed blue lines represent the significance level of the tests,  . We can clearly see that most of the p-values from the P-HOTB distributions are higher than the ones from the KEPLER distributions. Only for the W18 calibration with KEPLER are the p-values given by the A–D test below
 .
Download figure:
Standard image High-resolution image Taking these results at face value and given the conclusion from Smartt (2015) that  , we might speculate that predictions of
 from the neutrino mechanism are compatible with currently existing observations of SNe II. Nonetheless, we are not taking into account the uncertainties in the observed
 and biases due to sample completeness. A larger and more complete sample is also needed to have better statistics and to obtain more robust results, where ongoing (e.g., ASAS-SN) and future surveys (e.g., ZTF, LSST) will play a key role. It is possible that better scaling relations than Litvinova & Nadezhin (1985) and Popov (1993) that include a more realistic approach will reveal correlations between quantities such as
 and
 . We also need to take into account that 1D models take into account multidimensional fluid instabilities and mixing at best only approximately (e.g., Janka 2012; Burrows 2013; Takiwaki et al. 2014), and a larger sample of progenitors and calibrations need to be tested since the ones used in this work may not be fully representative of the true nature of core-collapse explosions.
In this work we have doubled the sample of normal SNe II from Pejcha & Prieto (2015a, 2015b) and used the same code to fit multicolor light curves and expansion velocity curves. The slopes and intrinsic widths of the correlations between  , plateau luminosity at 50 days after explosion, and
 are compatible with those of Pejcha & Prieto (2015b).
We studied the completeness of our joint sample and found that the sample has a slight deficit on the low-luminosity end. More low-luminosity SNe with lower  would perhaps improve the match in the lowest bin of
 distributions, so a larger sample is needed to increase the statistics.
We convolved a Salpeter IMF, with  and
 ranging from 15 to
 , with the progenitor masses from Sukhbold et al. (2016) to retrieve a set of theoretical
 distributions from the N20, W18, and Z9.6 model calibrations presented in their work and for two different hydrodynamic codes, Prometheus Hot Bubble (P-HOTB) and KEPLER. We compared these distributions with our joint sample through a two-sample K-S test and a two-sample Anderson–Darling test, obtaining some slightly significant differences between both codes. The p-values calculated suggest that KEPLER and P-HOTB match the observational (joint) sample in general for different
 and progenitor calibrations.
Our work is one of the steps necessary to verify the explosion mechanism of CCSNe, and this could help us understand the emerging theoretical pattern that success and failure of core collapse in massive stars depend sensitively on initial conditions and are not monotonic in the initial mass. The theoretical work on 1D parameterized models has provided a suite of observationally testable predictions. Further progress in this area will likely require closer interaction of the parameterized models with multidimensional simulations.
We thank M. Hamuy and C. Gutiérrez for providing the optical spectra for several of the SNe. We thank Tuguldur Sukhbold, Thomas Janka, and Todd Thompson for discussions and detailed comments on the manuscript. We also thank the referee for detailed comments. T.M., J.L.P., and A.C. were supported in part by the Ministry of Economy, Development, and Tourism’s Millennium Science Initiative through grant IC120009, awarded to the Millennium Institute of Astrophysics, MAS. Support for J.L.P. was also provided by FONDECYT through grant 1151445. Support for O.P. was provided in part by NASA through Hubble Fellowship grant HST-HF-51327.01-A awarded by the Space Telescope Science Institute, which is operated by the Association of Universities for Research in Astronomy, Inc., for NASA, under contract NAS 5-26555. T.M. and A.C. were also supported by CONICYT through grant Basal CATA PFB 06/09.
Appendix:
In Figures 7, 8, 9 and 10 we show the resulting fits for our full sample of SNe II.
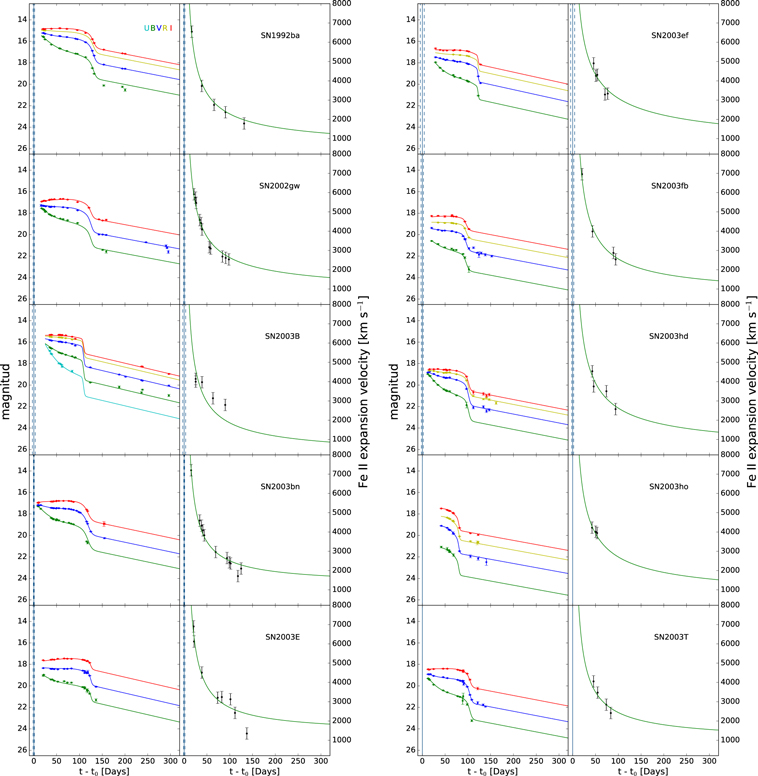
Figure 7. Multiband light curves and photospheric expansion velocity curves along with their best-fit models for 10 out of the 16 SNe II (remaining objects are shown in Figures 8 and 9). The left panels of both columns show the light curves in the optical bands, while the right panels show the expansion velocity curves for each SN. The vertical solid blue lines represent the explosion times  derived from the fits with their uncertainties (vertical dashed blue lines). Each SN has the same vertical and horizontal axis ranges.
Download figure:
Standard image High-resolution image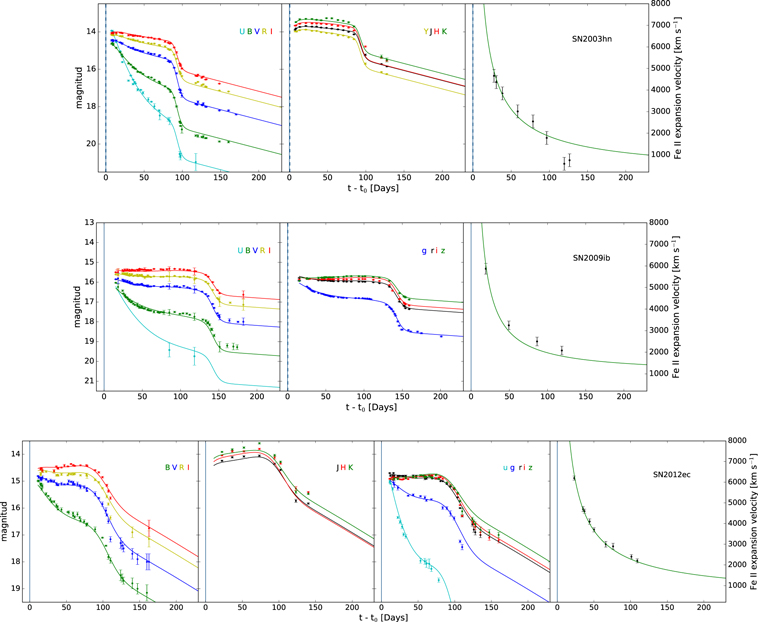
Figure 8. Same as in Figure 7, but for SN 2003hn, SN 2009ib, and SN 2012ec.
Download figure:
Standard image High-resolution image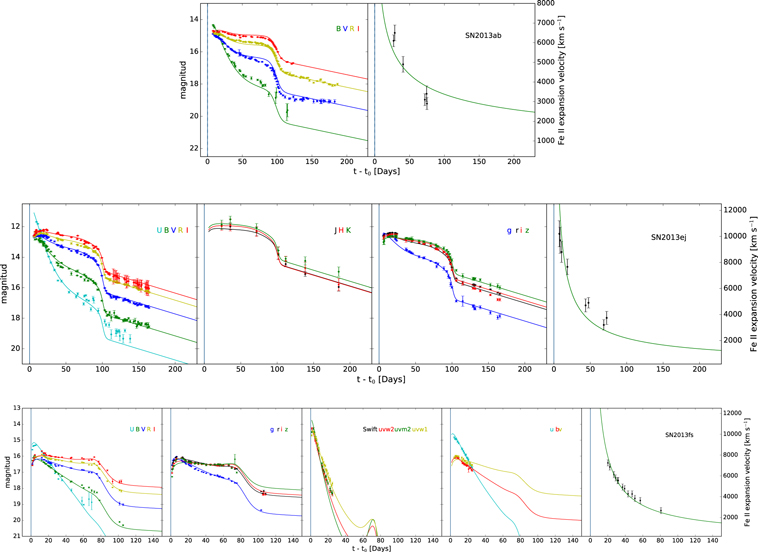
Figure 9. Same as in Figure 7, but for SN 2013ab, SN 2013ej, and SN 2013fs. Note that the vertical axis differs for each object.
Download figure:
Standard image High-resolution image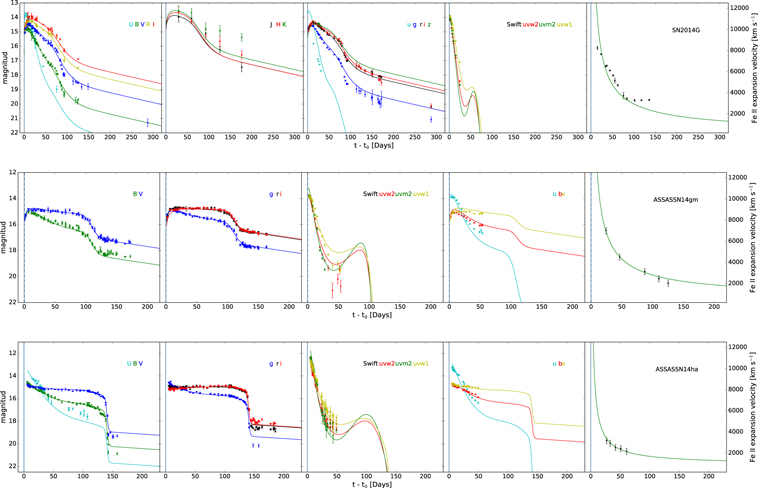


Figure 10. Same as in Figure 7, but for SN 2014G, ASASSN-14gm, and ASASSN-14 ha. Note that the vertical axis differs for each object.
Download figure:
Standard image High-resolution image
